The thresholds section of the dashboard shows the current status of each of the top level thresholds.
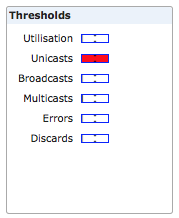
Each threshold category (Utilization, Unicasts, Broadcasts, Multicast, Errors, Discards) indicates the most severely violated threshold across all the switches that you are monitoring. The color of the bar indicates how severe the threshold violation is (green is normal, yellow is marginal and red is critical). Further detail of the threshold value is indicated by how far to the right the threshold bar is within the indicator. For more information on how thresholds work, see Chapter 7, Using and configuring thresholds.
You can drill-down to the causes of any threshold violation by clicking on a threshold indicator on the dashboard. This will take you to the thresholds screen, showing the thresholds for all the switches being monitored, sorted by the threshold category that you clicked on. For example, if you click on the broadcast threshold indicator in the dashboard, you will be taken to the thresholds view for all switches, sorted by broadcasts (highest threshold value first). This shows you the detail of the broadcast thresholds across the whole network, and allows you to find the switches contributing the most to threshold violations quickly.
Note that if a switch is deleted from sFlowTrend-Pro, if it was contributing to any of the thresholds shown on the dashboard, then this contribution will not be removed until the end of the current minute.