Configuring Traffic Sentinel - step by step guide
Traffic Sentinel is a powerful tool for monitoring and managing network activity in large multi-layer switched and routed networks. In order to operate correctly, some initial configuration is required.
The following steps are needed to fully configure Traffic Sentinel:
- Initial configuration
- Configure switches
- Discover switches
- Confirm traffic measurements
- Define administrative groupings
- List addresses space
- Assigning agents to groups
- Set thresholds
- Forward events
- Schedule reports
- Create user accounts
- Customize dashboard
It is recommended that you work through all the steps. This will familiarize you with the major components of the product and ensure that all the product features operate correctly. It is worth reading through all the steps before starting. While the steps are presented in a linear fashion, in practice configuration is more of an iterative process as you find the best way to organize information and settings.
Each of the steps is described in detail in the rest of this document.
1. Initial configuration
Once you have installed Traffic Sentinel, connect to its web interface.
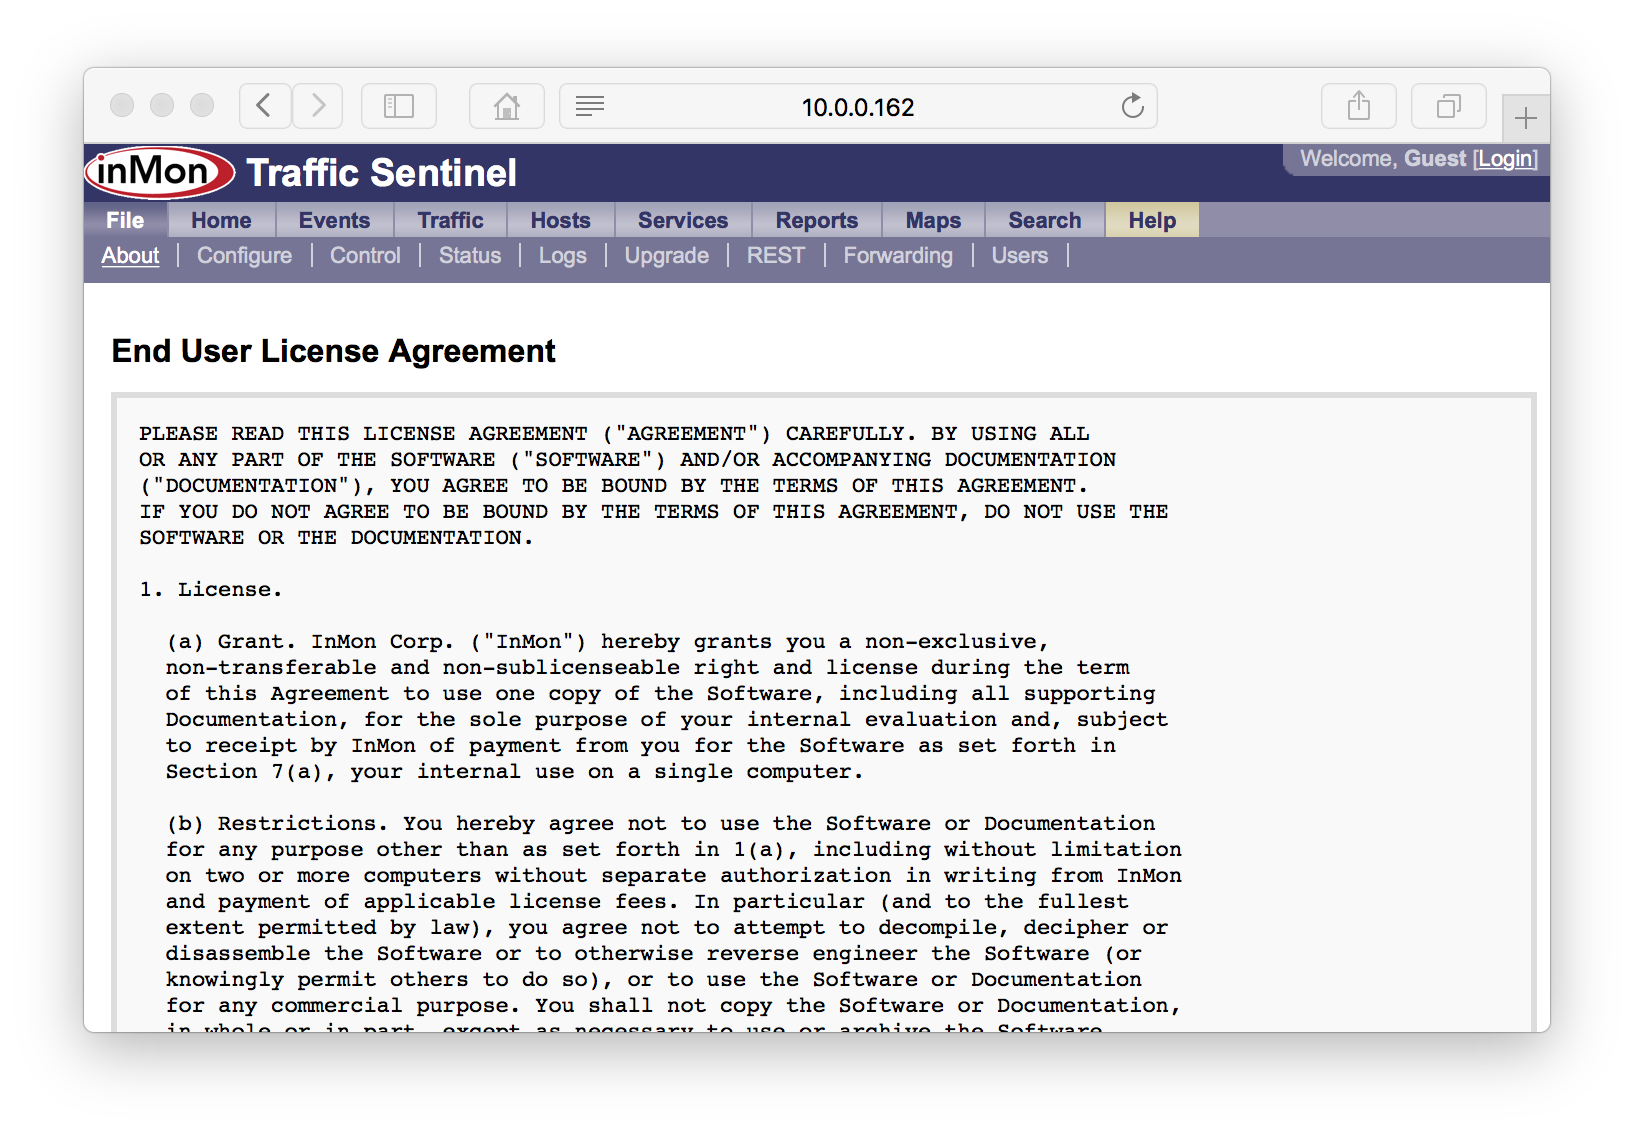
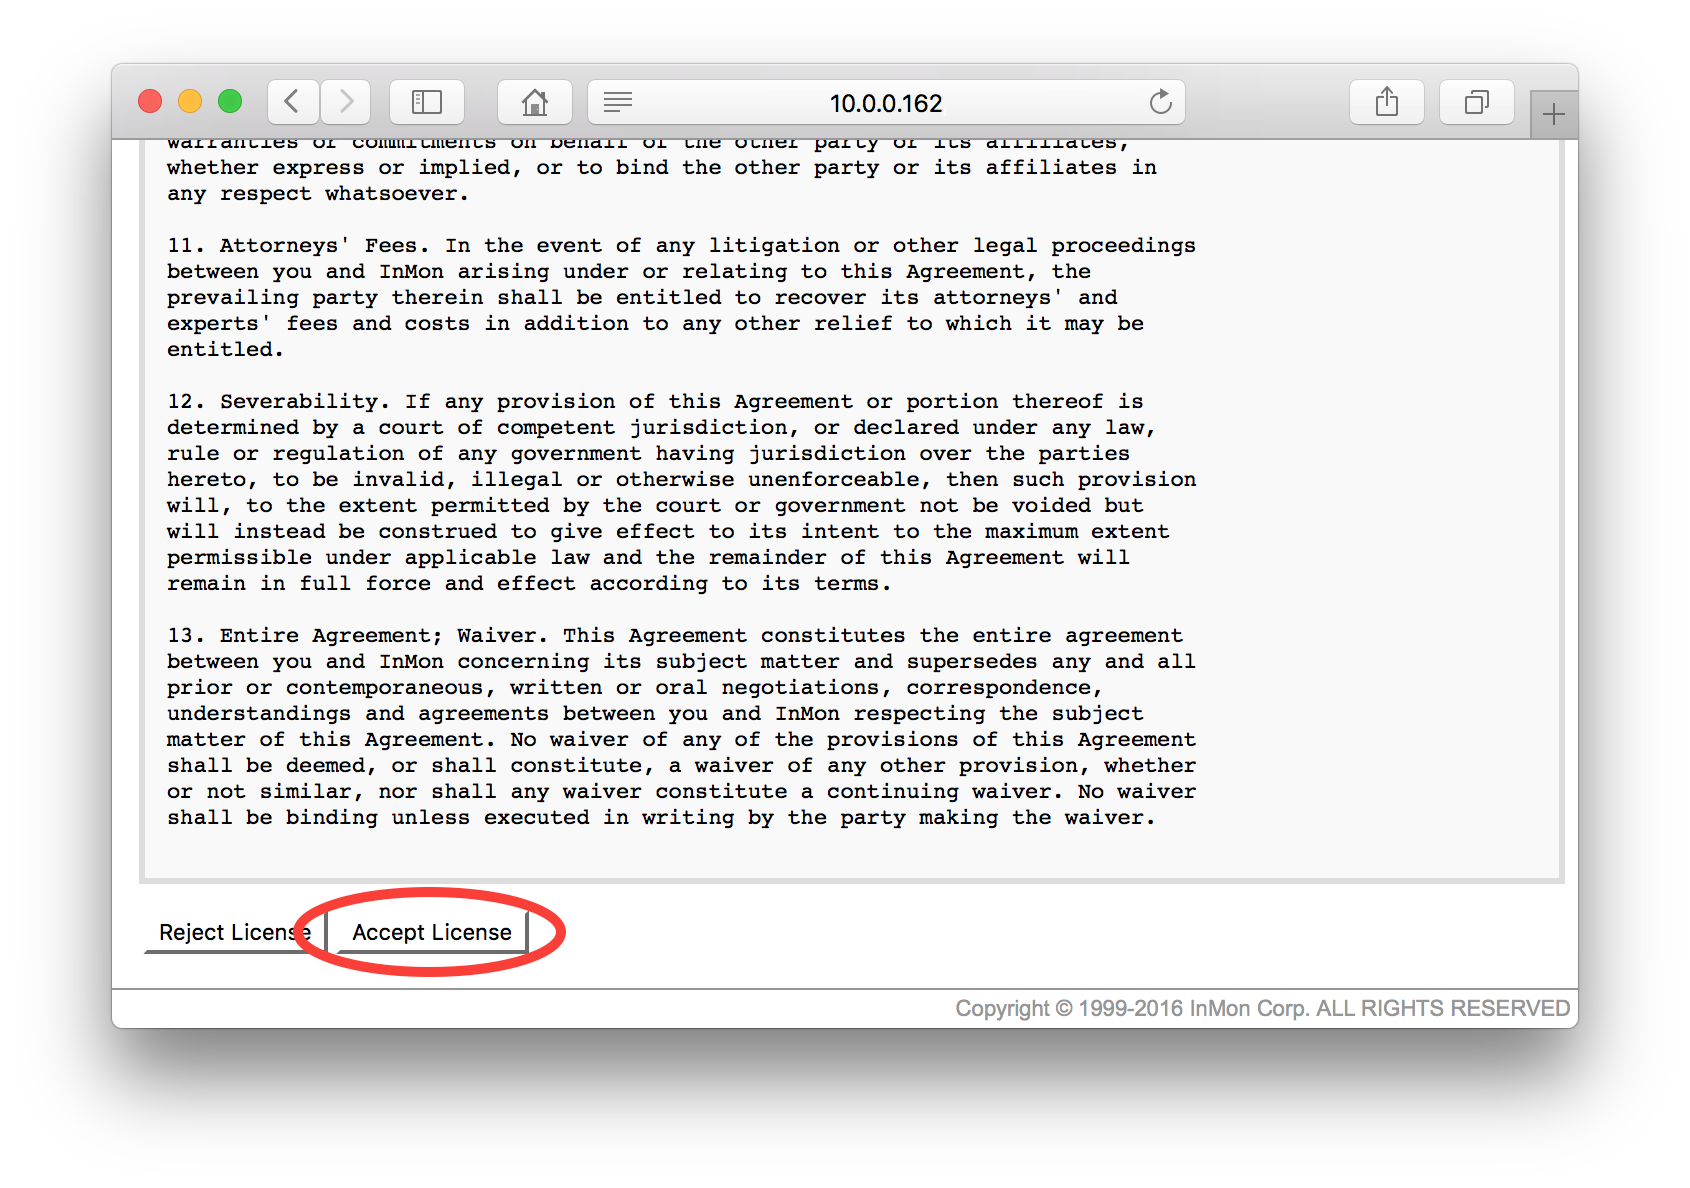
Scroll down to the bottom of the End User License Agreement and click on the Accept License button.
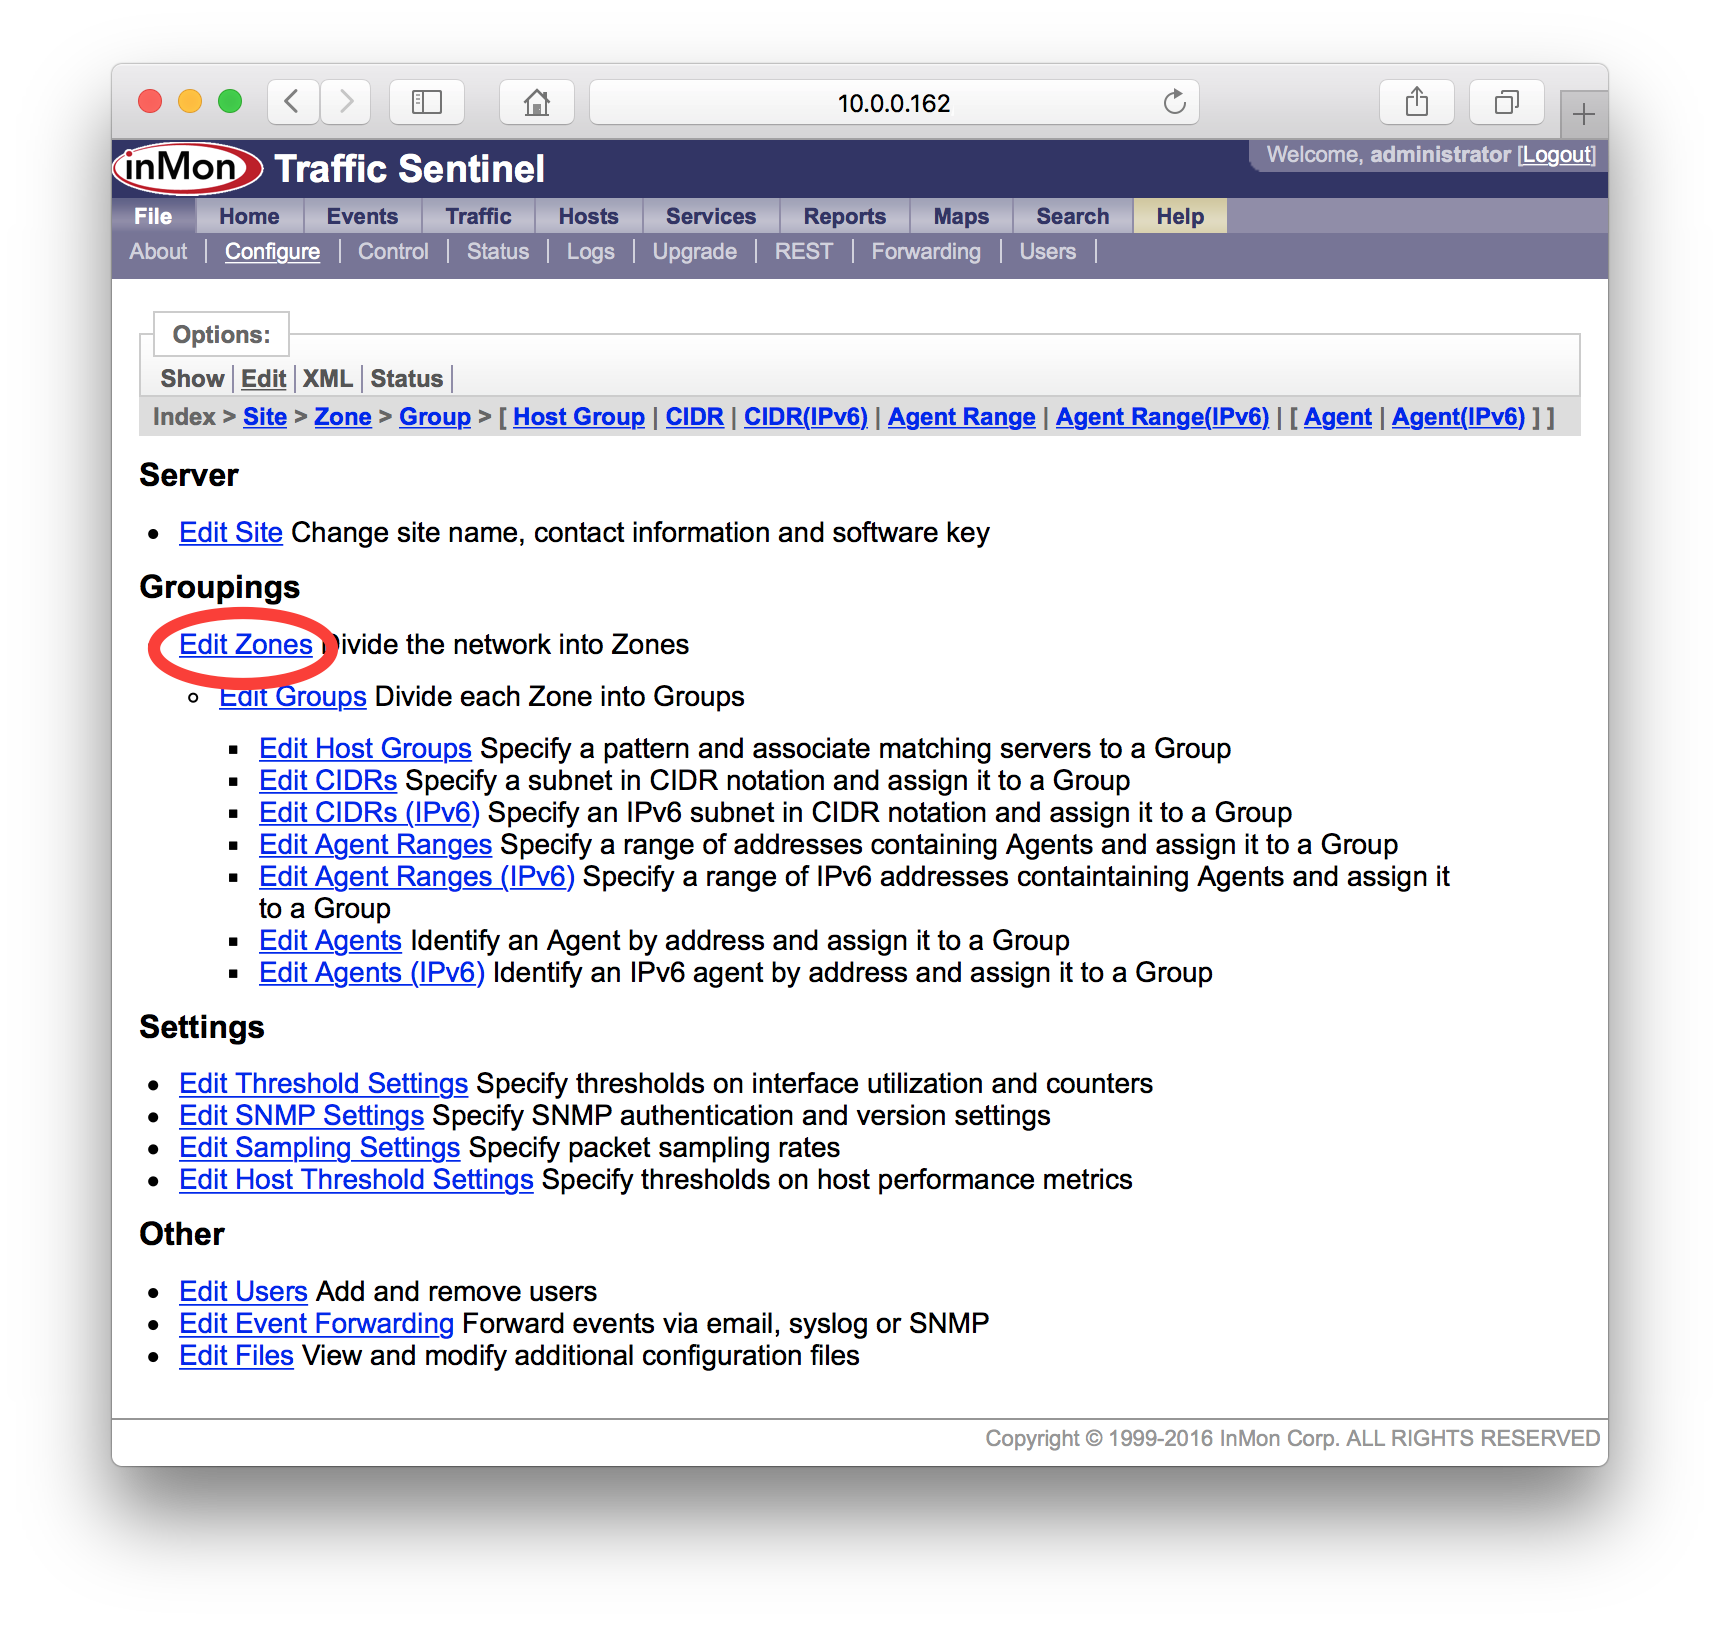
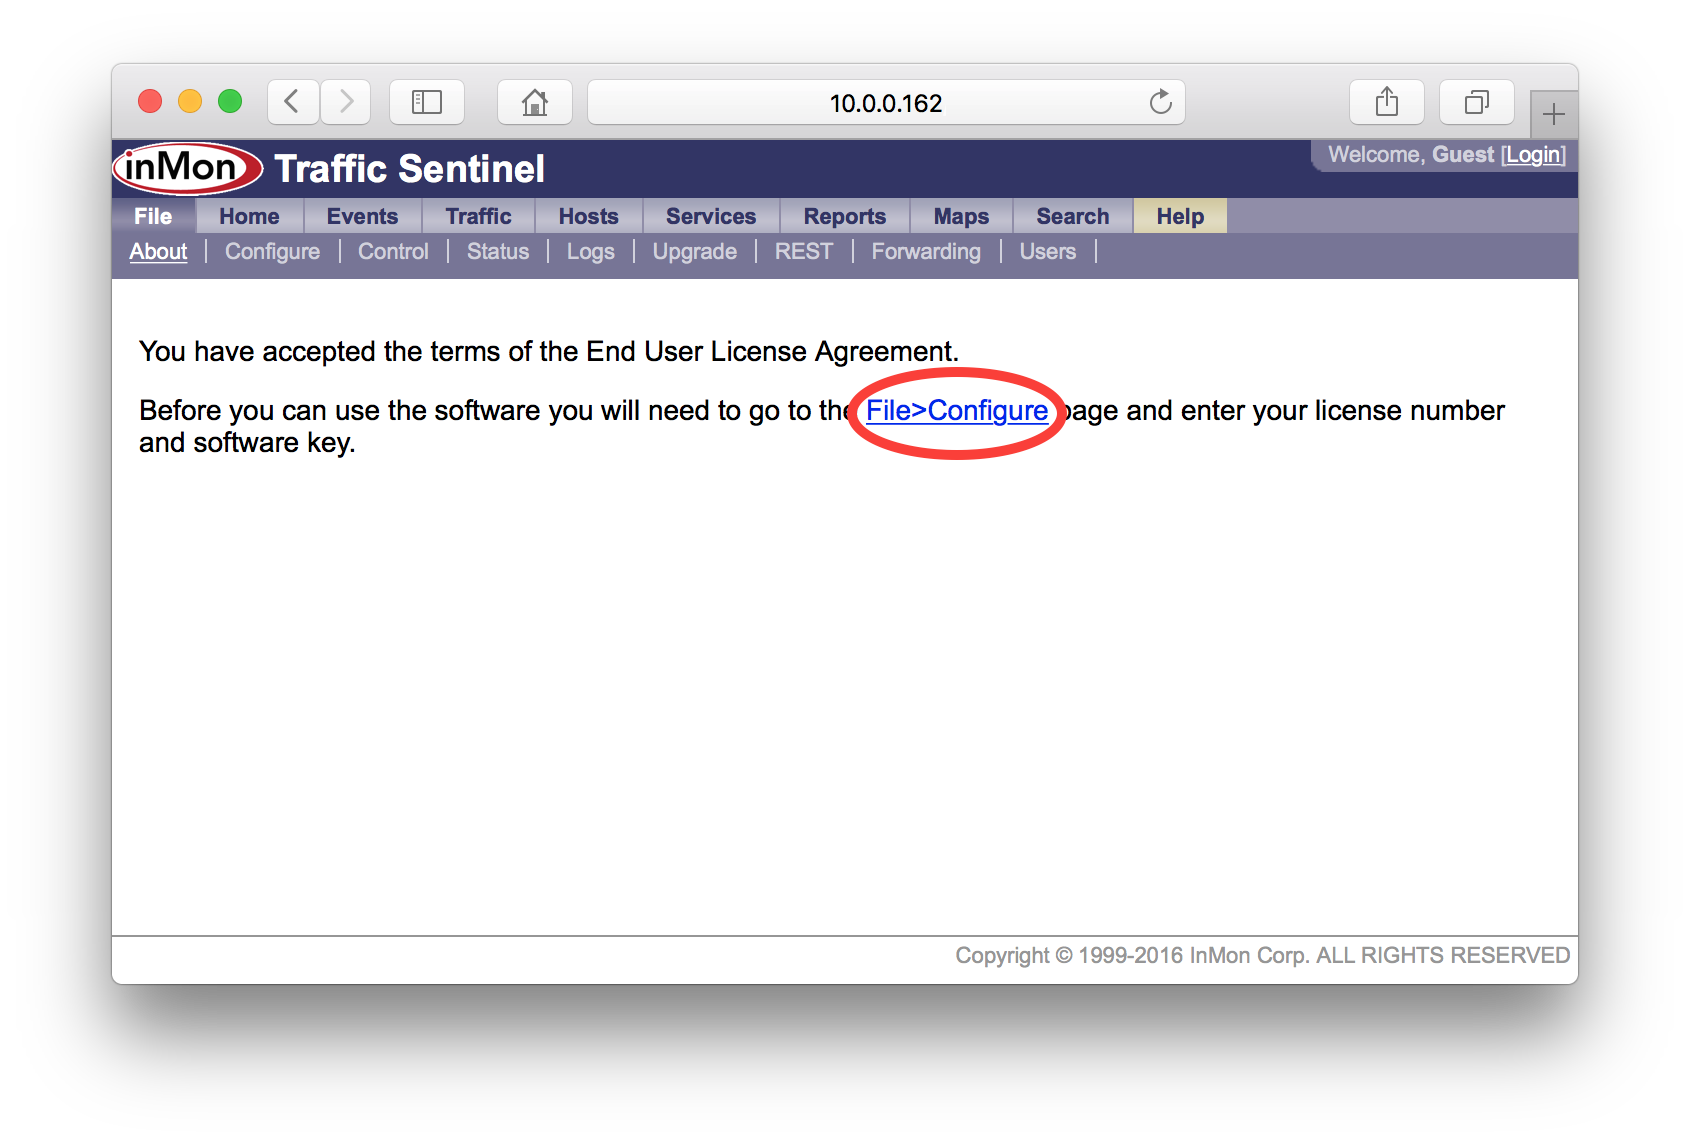
The next step is to enter an initial configuration, click on the File>Configure link to go to the configuration screen.
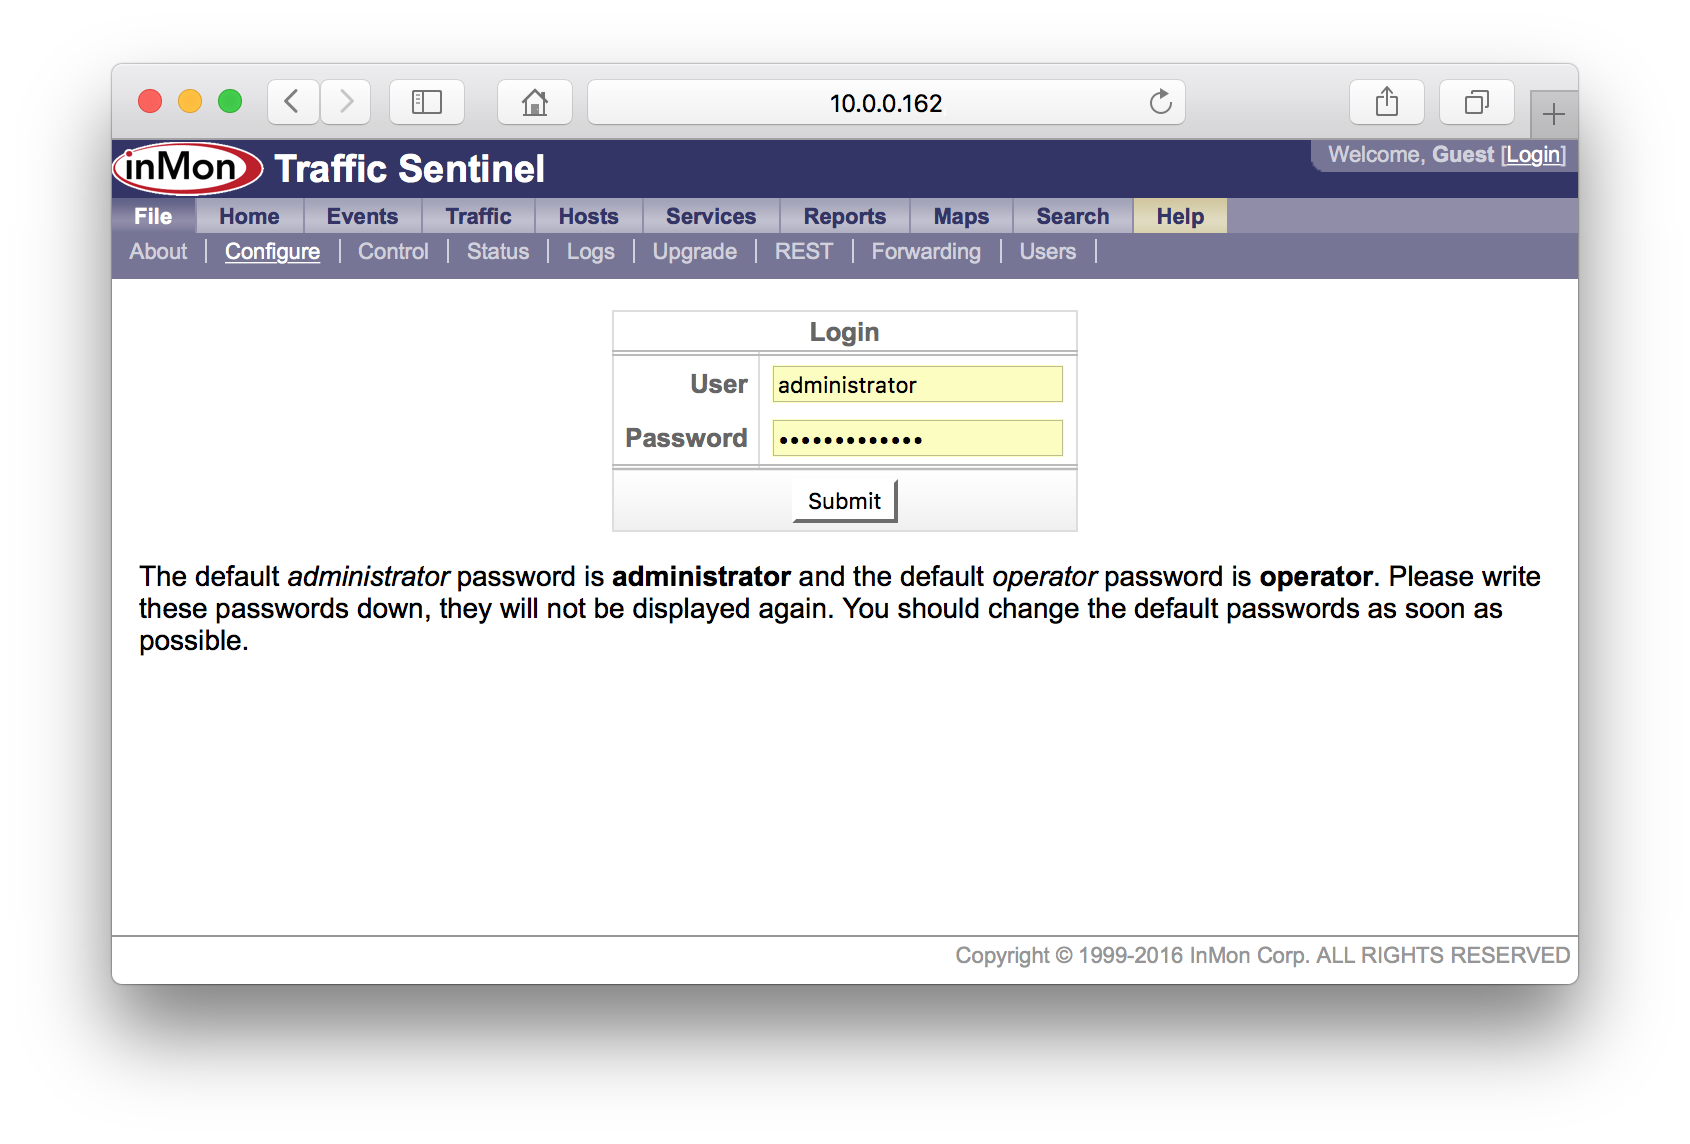
You will need to log in as an administrator in order to make configuration changes. Use the default username and password for the initial login (i.e. User: administrator, Password: administrator).
Note: Don't forget to change the default passwords when you configure user accounts (see 11. Create user accounts).
Once you have logged in you should see the Site Settings form.
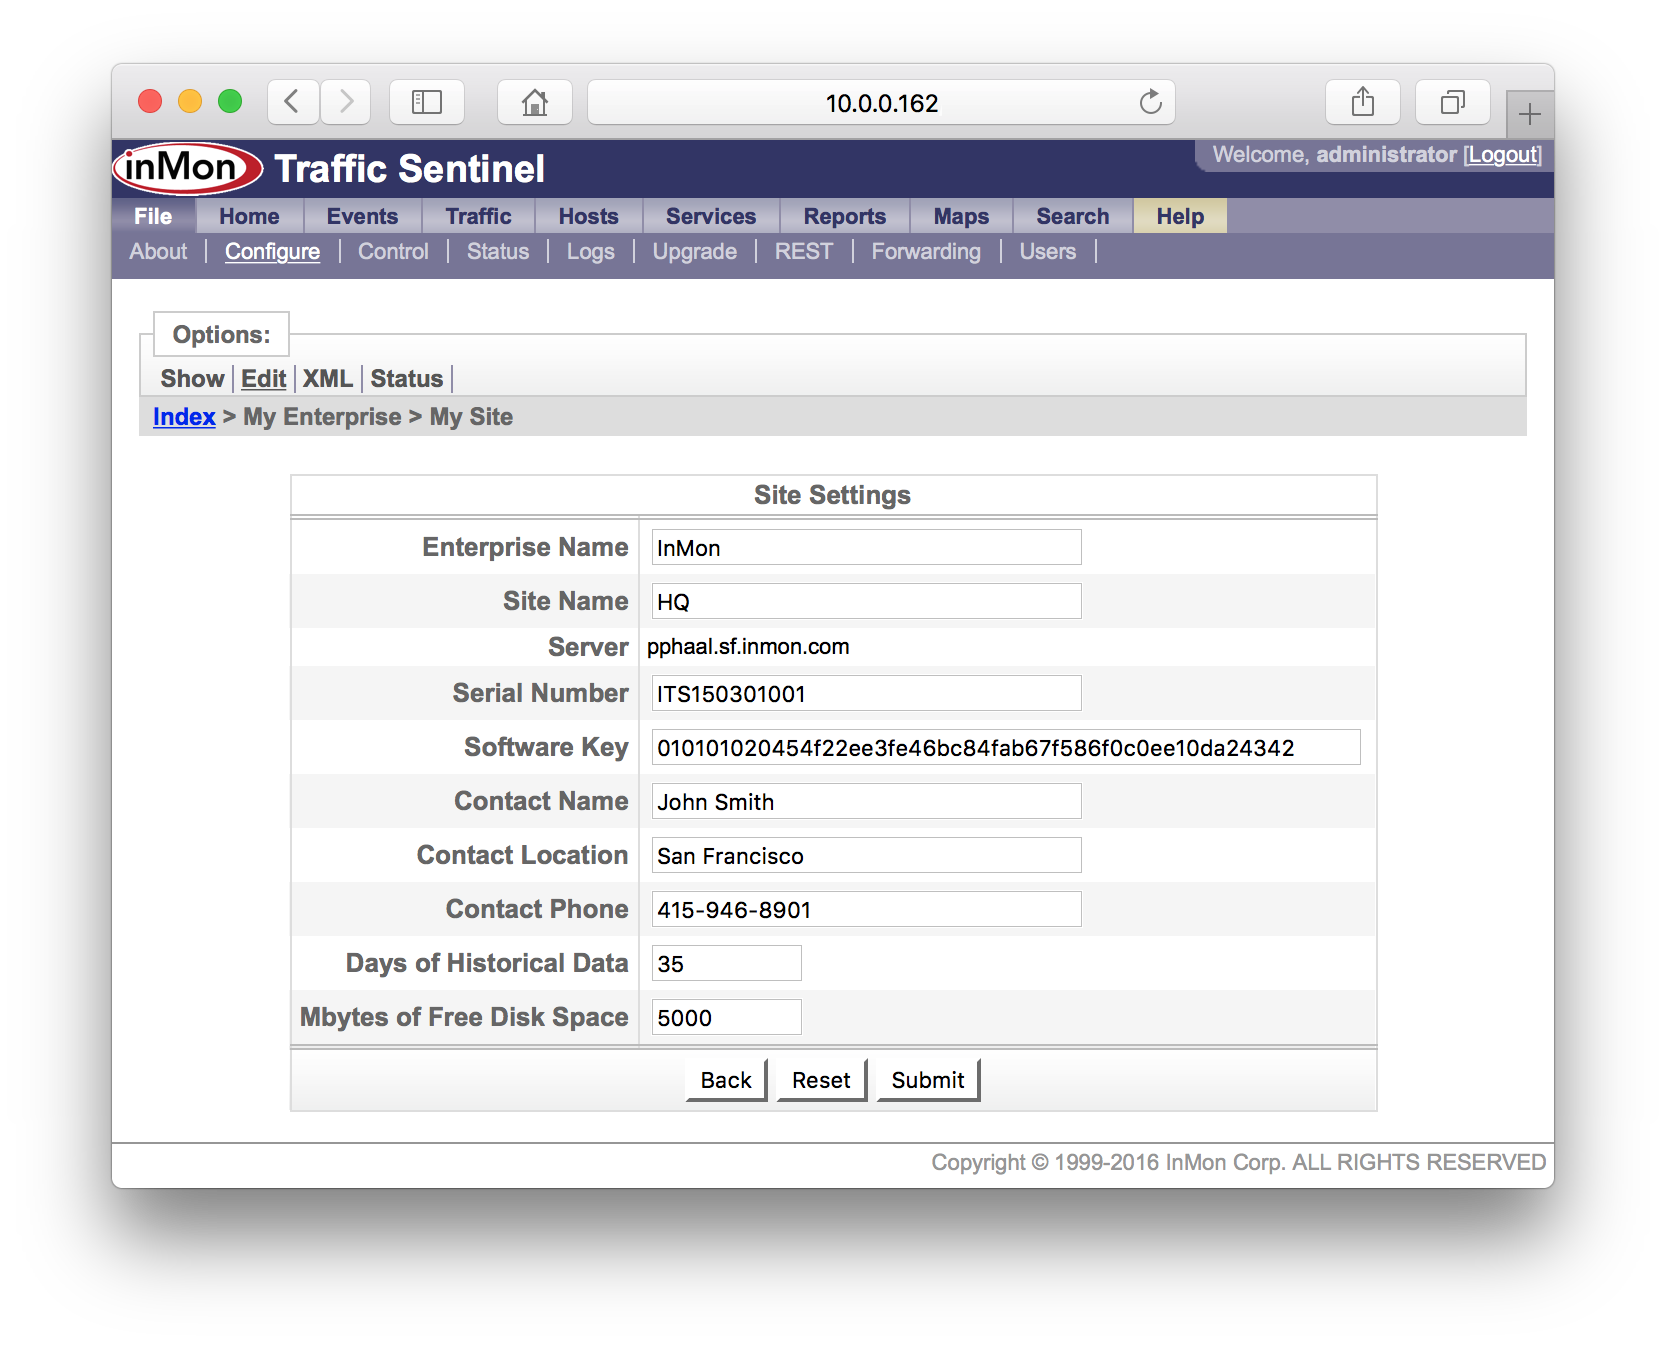
The settings in the Site Settings form are:
- Enterprise Name Enter the name of your organization. Short names or abreviations are recommended.
- Site Name Enter a name for the campus, data center or city containing the devices being monitored. Again short names are recommended.
- Server This non-editable field displays the hostname of the server running the Traffic Sentinel software.
- Serial Number Enter the serial number (provided by InMon) that corresponds to your software license. The serial number will start with the letters ITS and should be 12 digits long.
- Contact Name Enter the name of the person responsible for administering this Traffic Sentinel.
- Contact Location Enter a location for the contact person.
- Contact Phone Enter telephone number for the contact person.
- Days of Historical Data The number of days to keep the traffic history.
- Mbytes of Free Disk Space Historical data will automatically be deleted (oldest first) if the disk partition fills up.
Make sure that you enter the Software Key and Serial Number that were issued with your license. Also check to make sure that the reported Server name matches the host name you gave when you requested the software key (if the server name doesn't match then check the FAQ entry: How can I change the hostname to match the software key?).
Note: Online help is available for each screen, just click on the Help link at the top right of the screen.
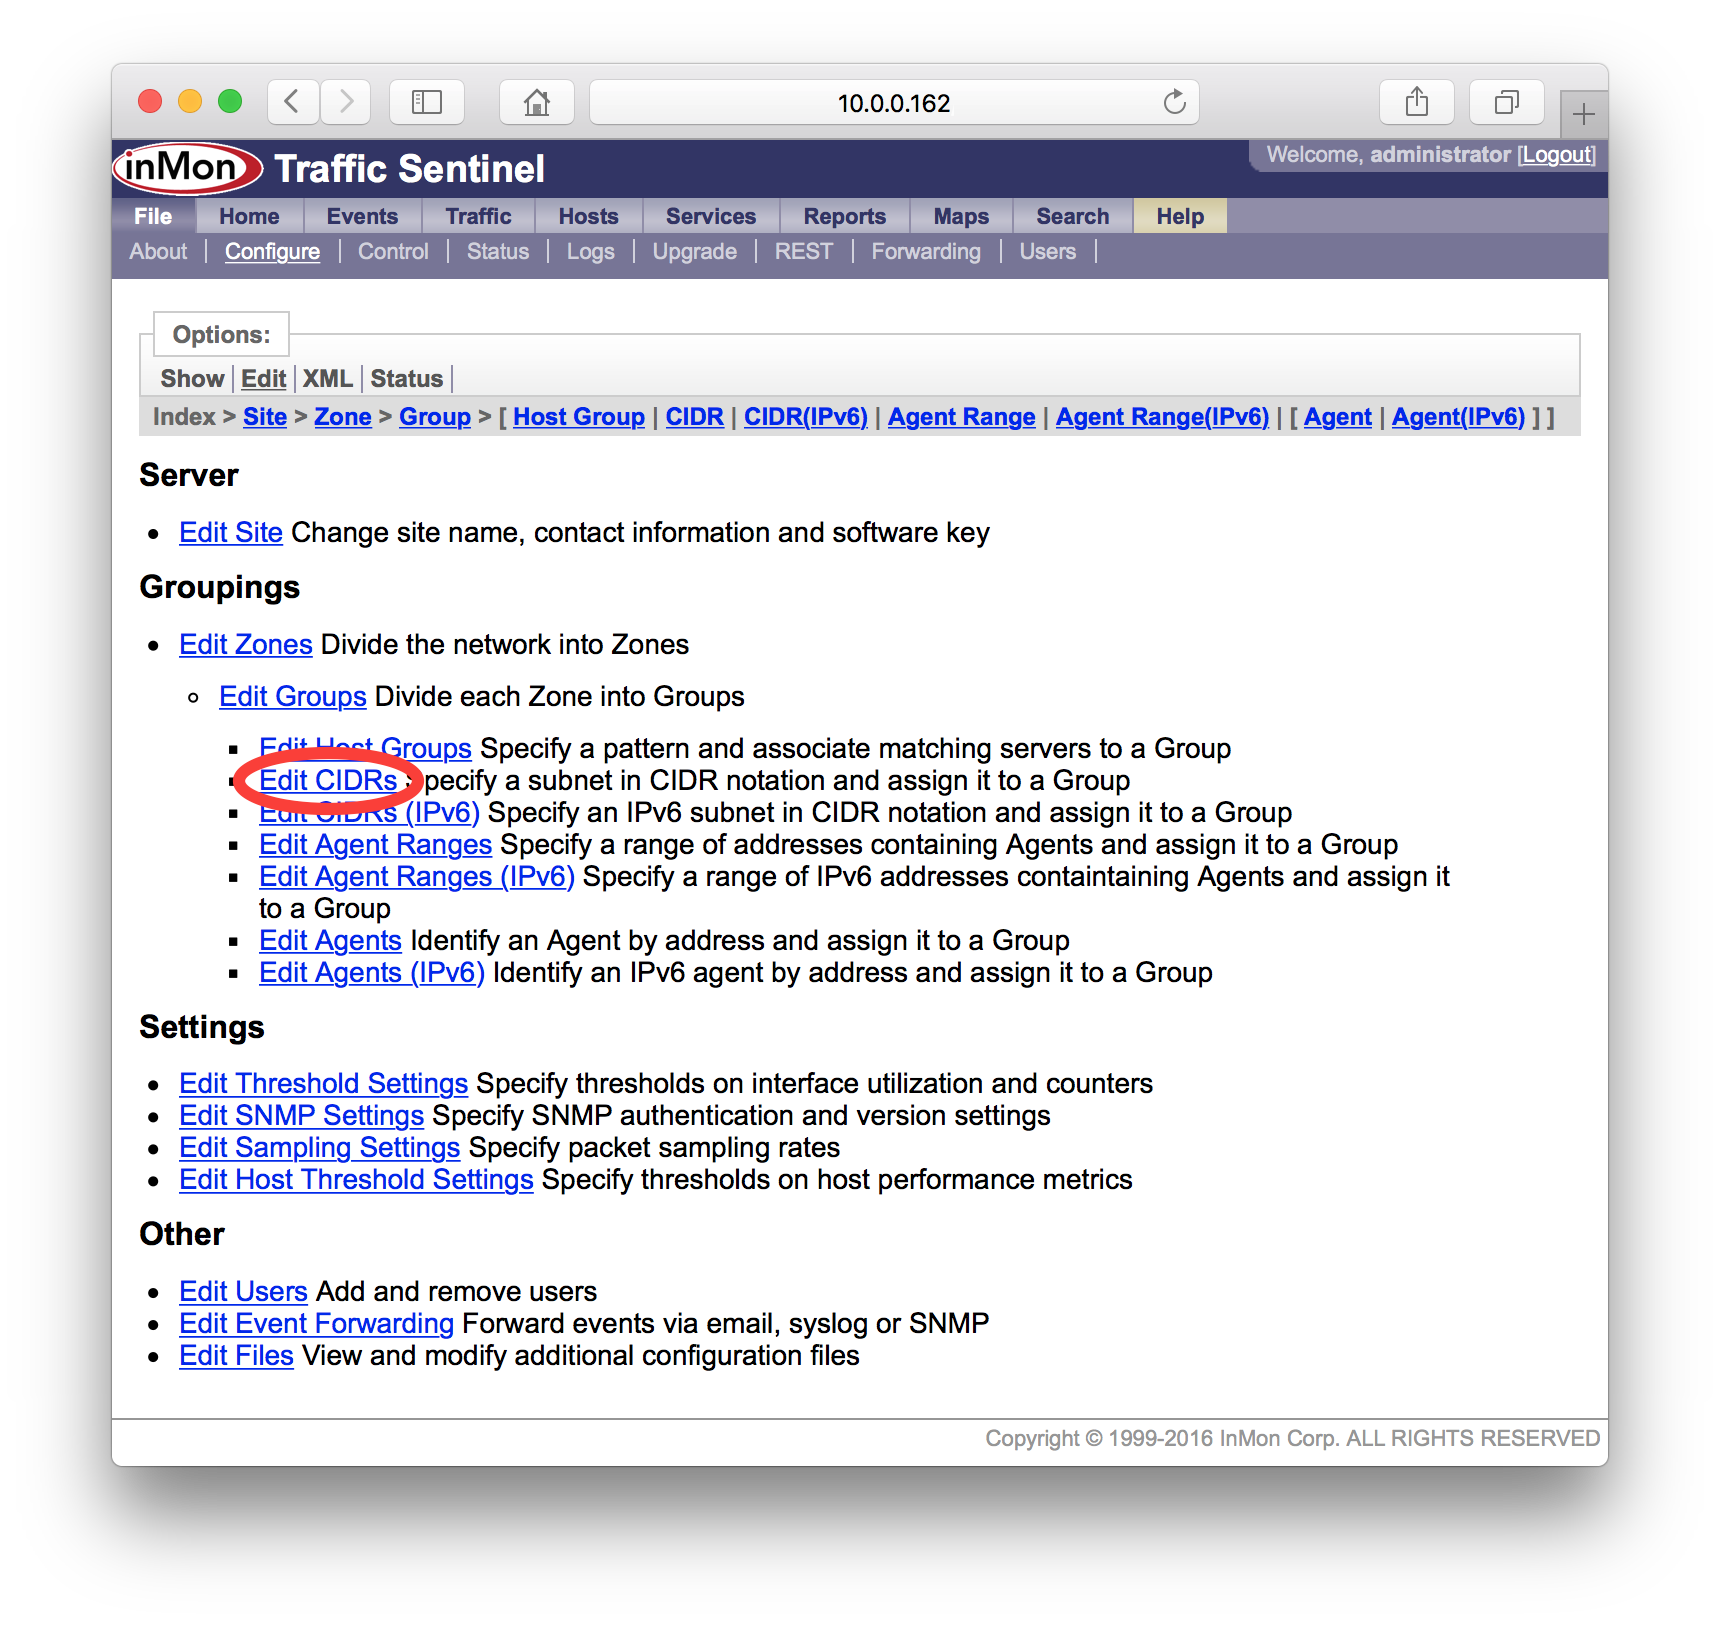
If the software key has been accepted, the following configuration screen will appear giving access to all the configuration options:
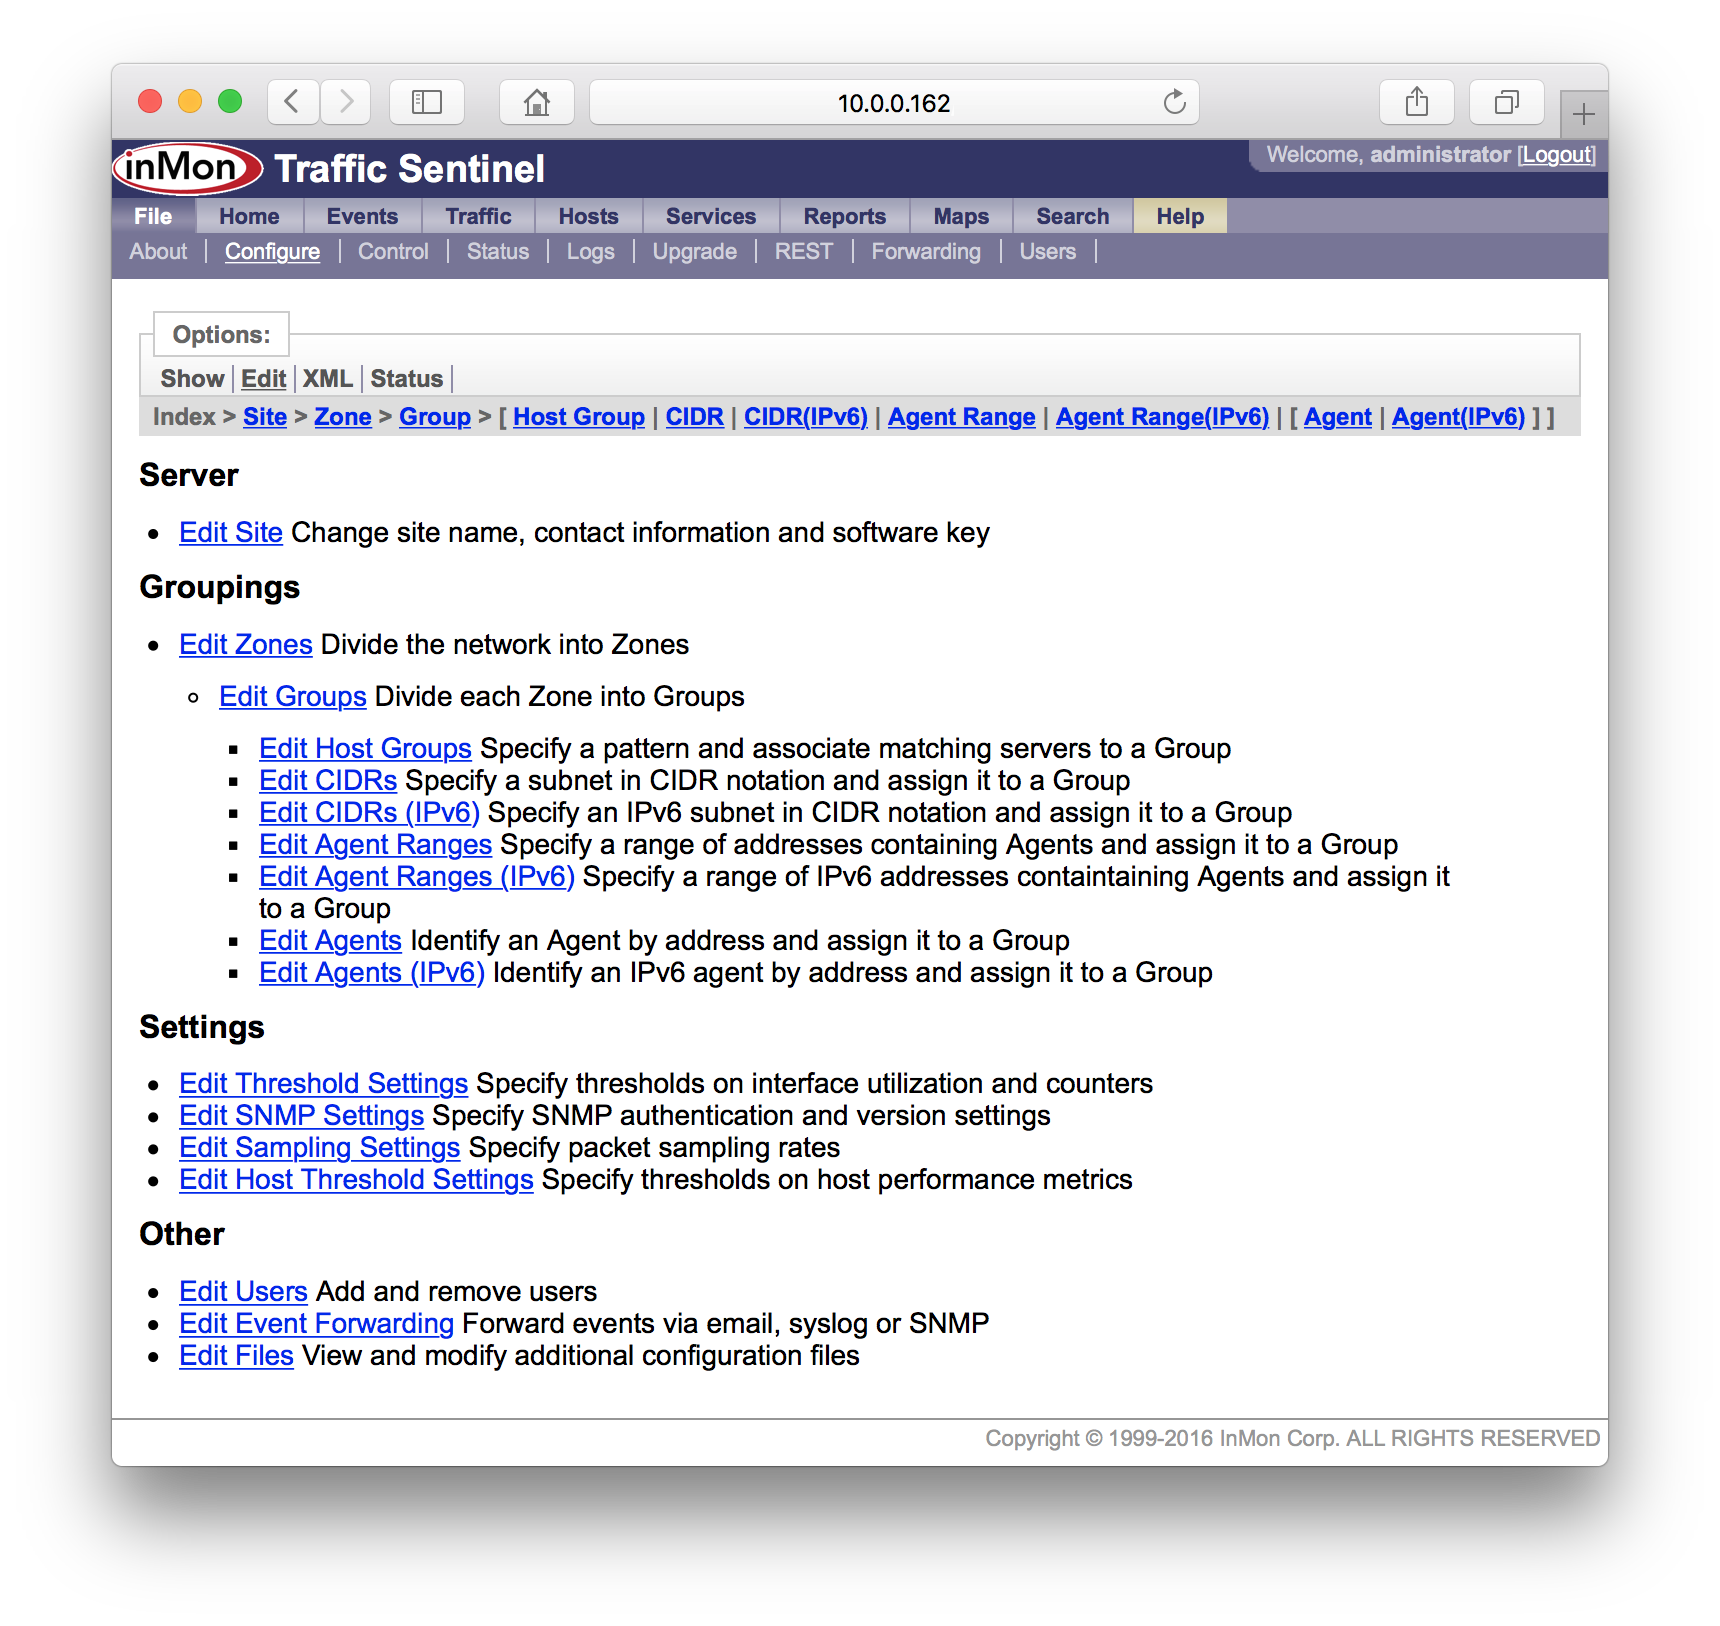
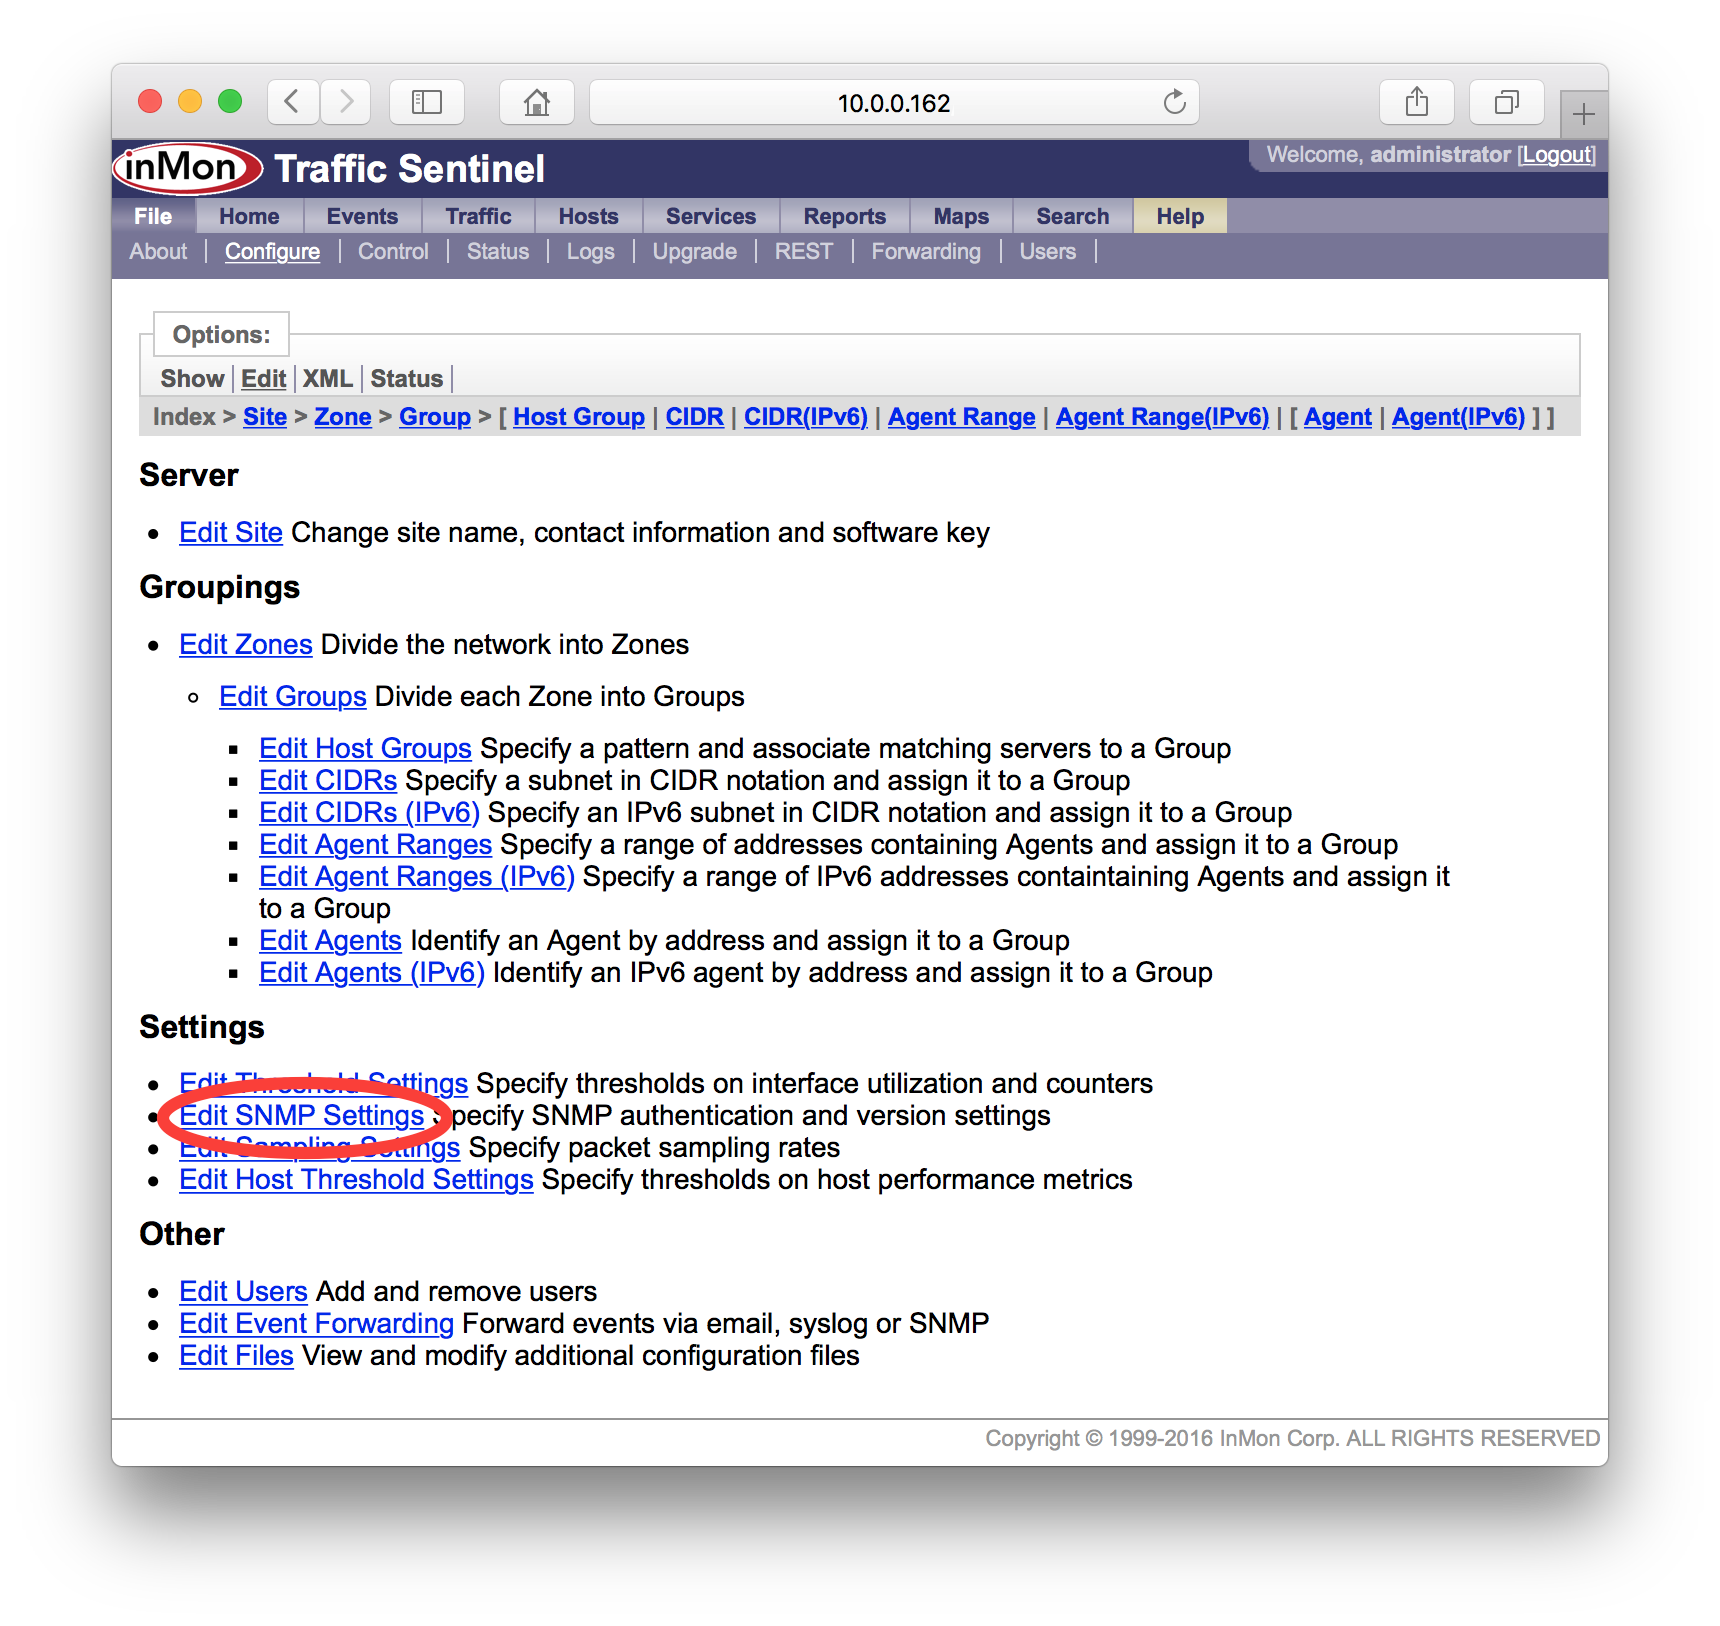
By default, Traffic Sentinel will use SNMP version 2c with the community string "public". If you need to change these settings, click on the Edit SNMP Settings link on the configuration screen to configure the SNMP settings.
The table lists SNMP settings that have been defined for different parts of the network. In this case there is only one "site-level" setting.
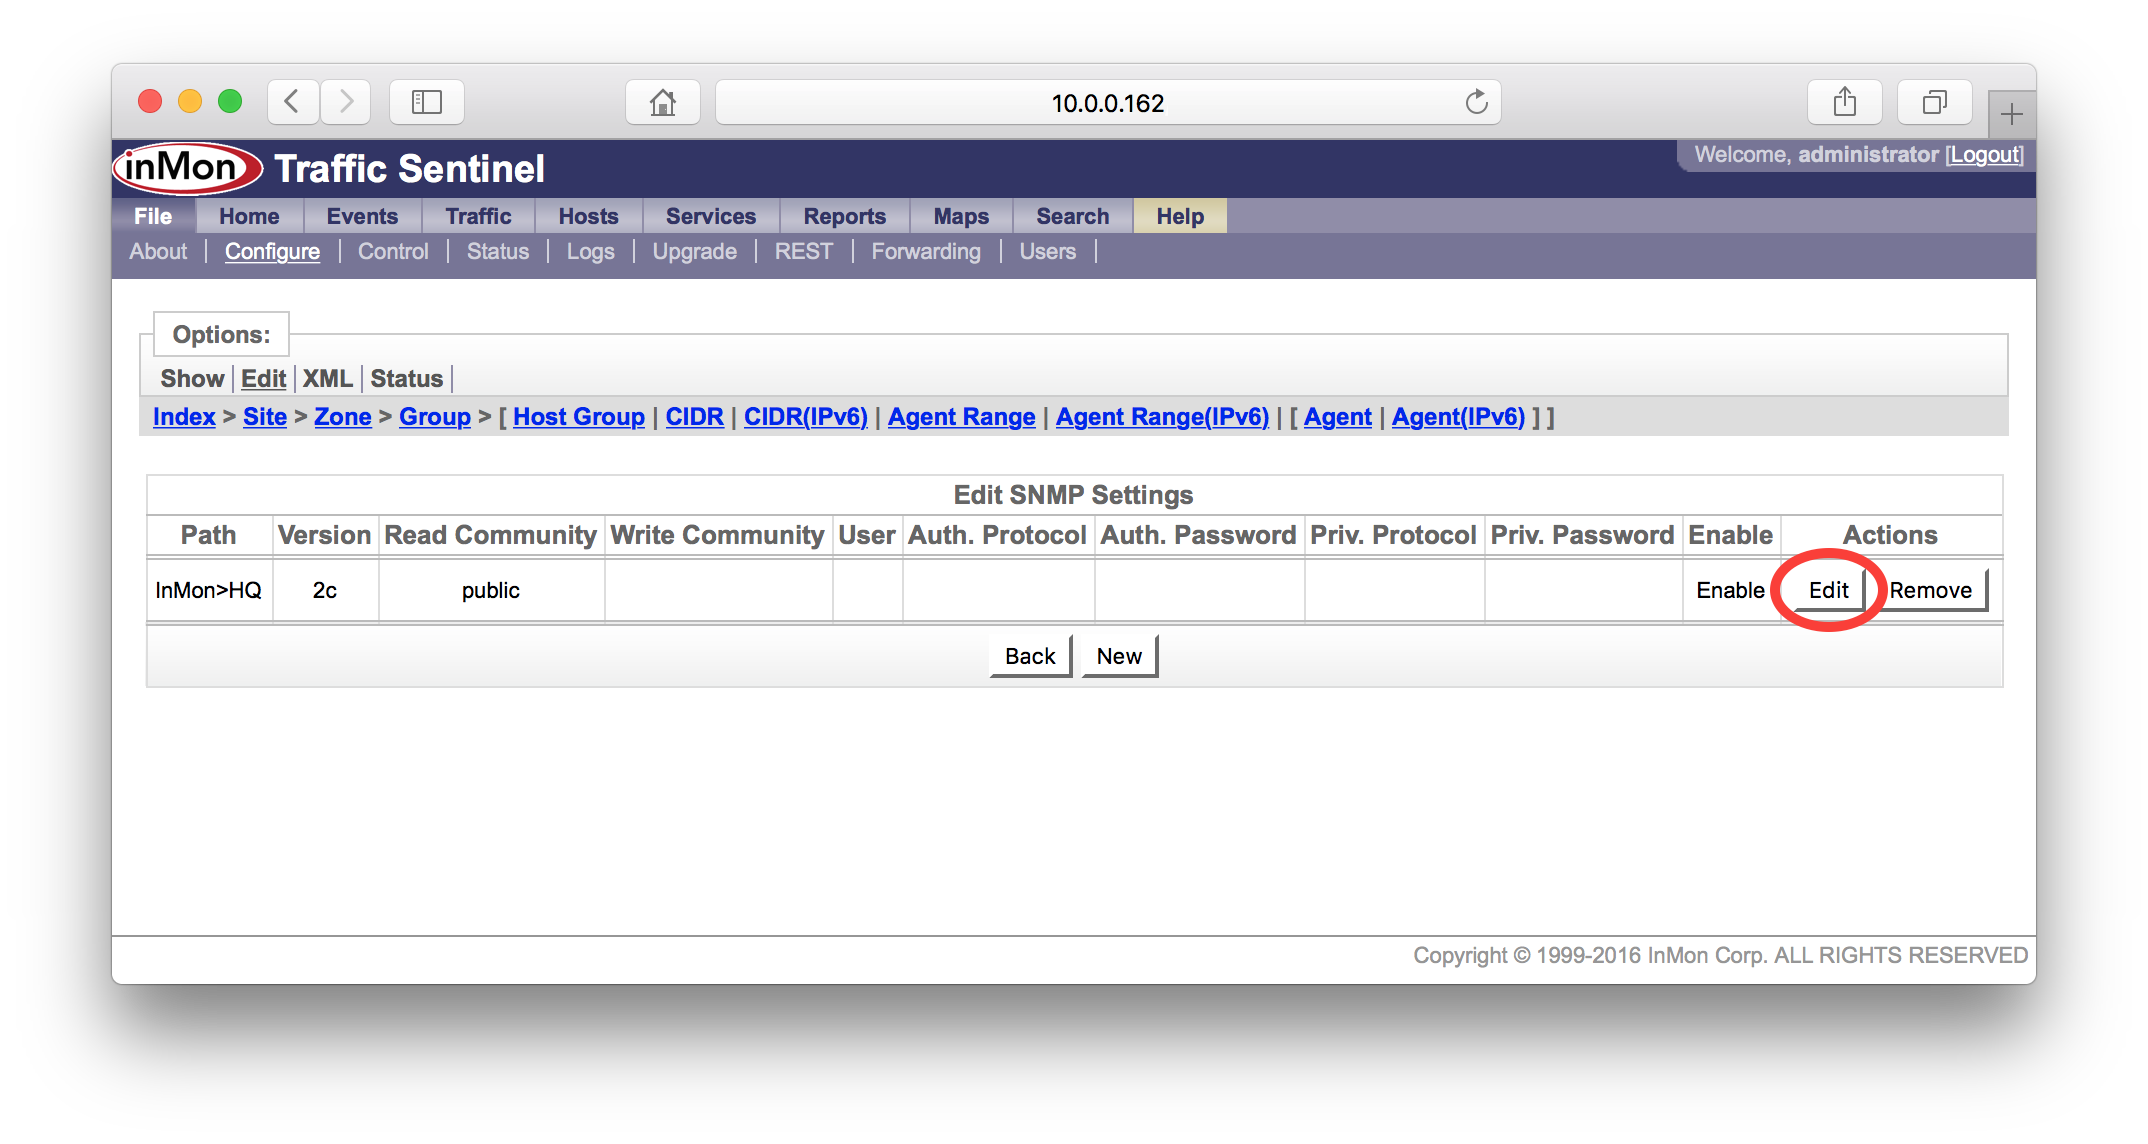
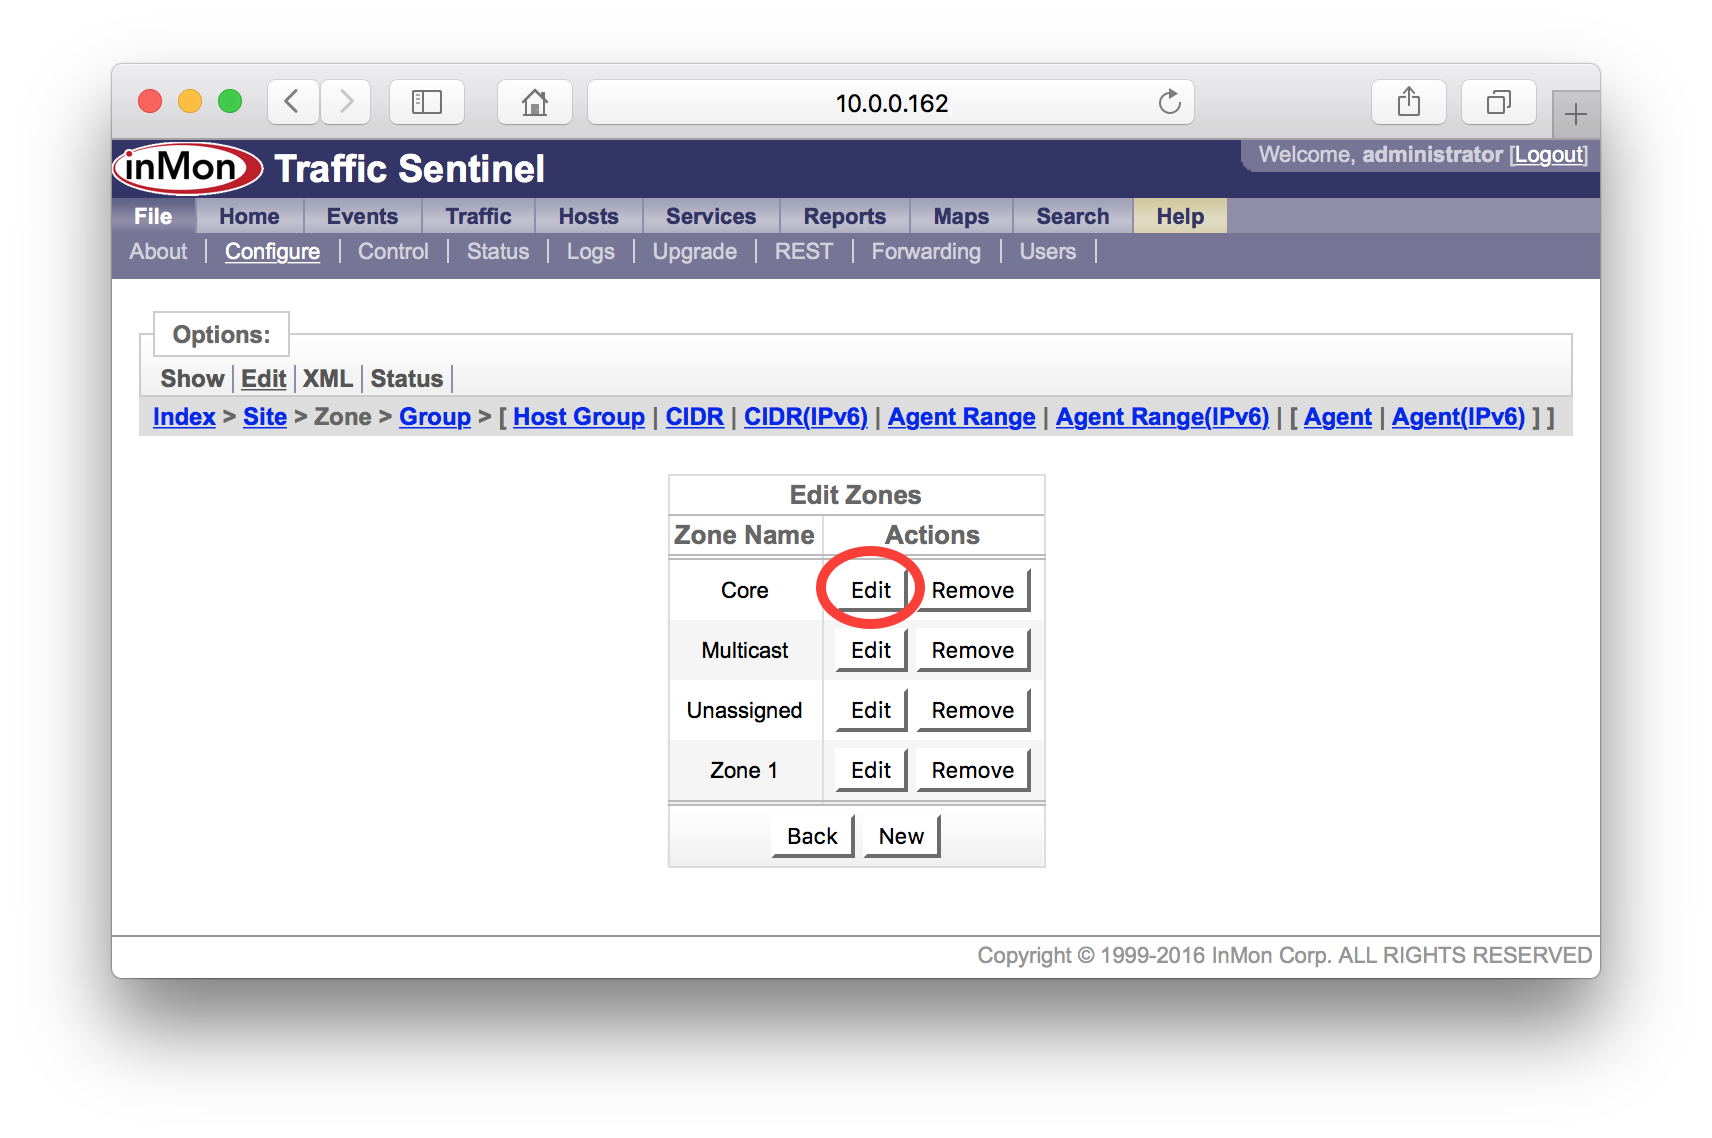
Click on the Edit button to edit the entry.
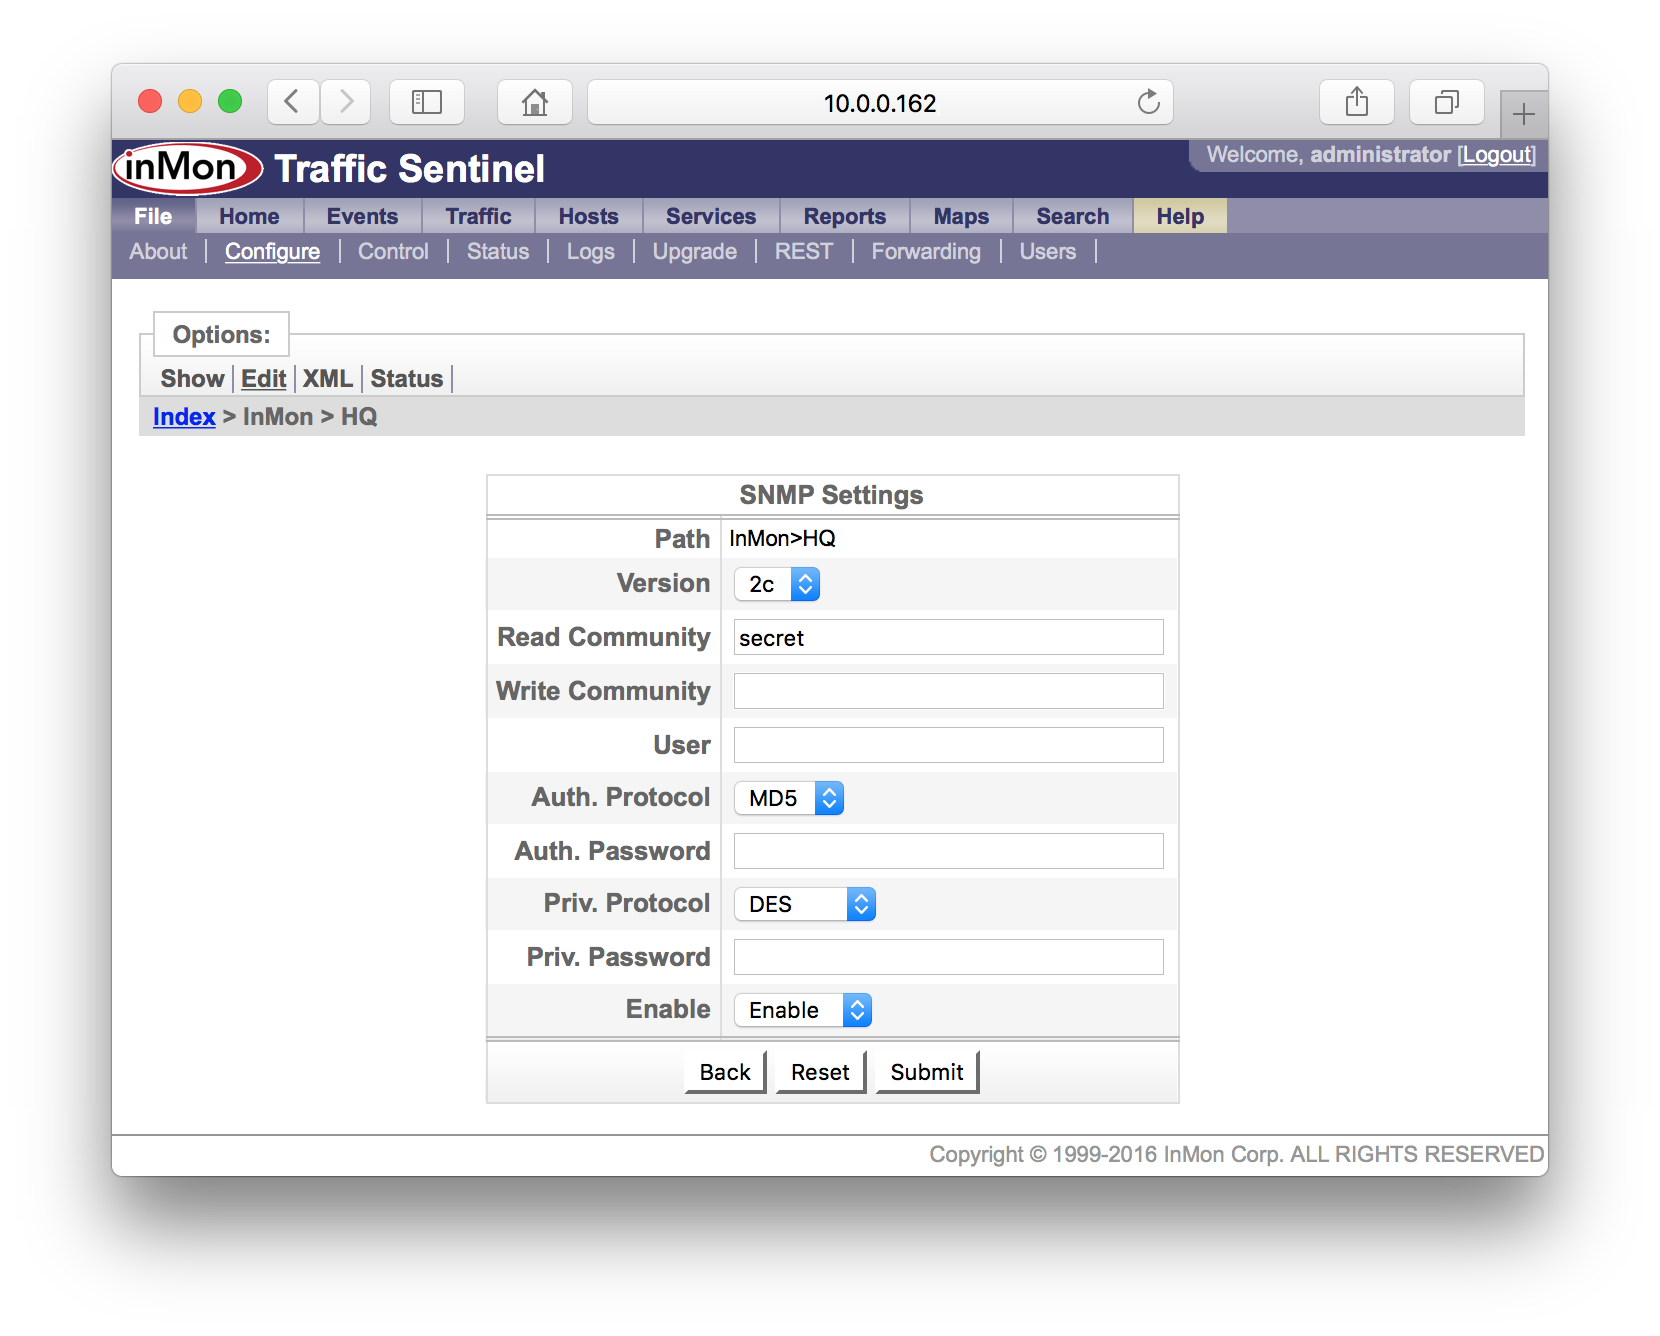
Fill in the new SNMP settings and click on the Submit button to make the changes. In this example we are changing the community string to "secret". If you want detailed information on the SNMP settings, just click on the Help link at the top right of the screen.
Note: In this example, the changed SNMP settings will be used to talk with all devices on the site (i.e. it was a "site-level" change). Later in this tutorial, you will see that it is possible to group switches and apply different settings to each group.
2. Configure switches
Depending on your network equipment and the protocols you are going to use to monitor each network device, there may be some switch configuration changes required. Typically these tasks will involve logging into each switch and using using the switch CLI (Command Line Interface) to make the changes.
- SNMP It is important that Traffic Sentinel by able to use SNMP to collect information from all the switches you want to monitor. You should make sure that SNMP is enabled on the switches and that any security policies in place on the switches permit Traffic Sentinel to make SNMP requests. You will need information on the SNMP settings on the switches (SNMP community string, SNMP version, passwords etc.) in order to configure Traffic Sentinel.
- sFlow® sFlow can be configured using SNMP or through the switch
CLI. However, the mechanisms that are available will depend on the switch
vendor. If your vendor supports the sFlow MIB, you will need to make sure
that Traffic Sentinel is allowed SNMP read/write access. If you are
configuring sFlow through the switch CLI then you will need to consult
your switch vendors documentation for the settings. The following FAQ entries
describe typical configuration settings:
- How do I configure sFlow on my Brocade switch?
- How do I configure sFlow on my Force10 switch?
- How do I configure sFlow on my Extreme Networks switch?
- How do I configure sFlow on my Hewlett-Packard ProCurve switch?
- How do I configure sFlow on my Juniper switch?
- How do I configure sFlow on my Alcatel-Lucent OmniSwitch?
- NetFlow© NetFlow is configured through the switch CLI, see: How do I configure NetFlow on my Cisco router? NetFlow does not provide interface counter information, so Traffic Sentinel will need to use SNMP to regularly poll the switch for interface counters (see SNMP configuration section above).
- JFlow© JFlow is configured through the switch CLI, see: How do I configure JFlow on my Juniper router? JFlow does not provide interface counter information, so Traffic Sentinel will need to use SNMP to regularly poll the switch for interface counters (see SNMP configuration section above).
- IPFIX IPFIX is configured through the switch CLI. IPFIX does not provide interface counter information, so Traffic Sentinel will need to use SNMP to regularly poll the switch for interface counters (see SNMP configuration section above).
When configuring sFlow devices through the CLI you will have to specify a "sflow counter polling interval". This setting determines how often interface counters are sent to Traffic Sentinel. The interface counters are used to calculate link utilizations and error rates and to trigger threshold events. An interval of 20 seconds is recommended.
When configuring traffic flow monitoring (i.e. sFlow, NetFlow, JFlow or IPFIX), it is recommended that you enable monitoring on all switch interfaces and that you configure the switch to use packet sampling (where possible). Packet sampling will reduce the monitoring overhead on the switches, reduce the amount of monitoring traffic on the network and will increase the number of switches and interfaces that you can monitor. The following default sampling rates are recommended:
| Link Speed | Sampling Rate |
|---|---|
| 10Mb/s | 1 in 200 |
| 100Mb/s | 1 in 500 |
| 1Gb/s | 1 in 1000 |
| 10Gb/s | 1 in 2000 |
Note: For most applications and most networks the default sampling rates will work well. If you have unusually high traffic levels you may want to increase the sampling rate (e.g. use 1 in 5000 instead of 1 in 2000 for your 10Gb/s links).
When configuring switches to send sFlow, NetFlow, JFlow or IPFIX data to Traffic Sentinel, it is important to make sure that you send each protocol to the correct port. The File>Status page lists the ports used to receive each type of data:
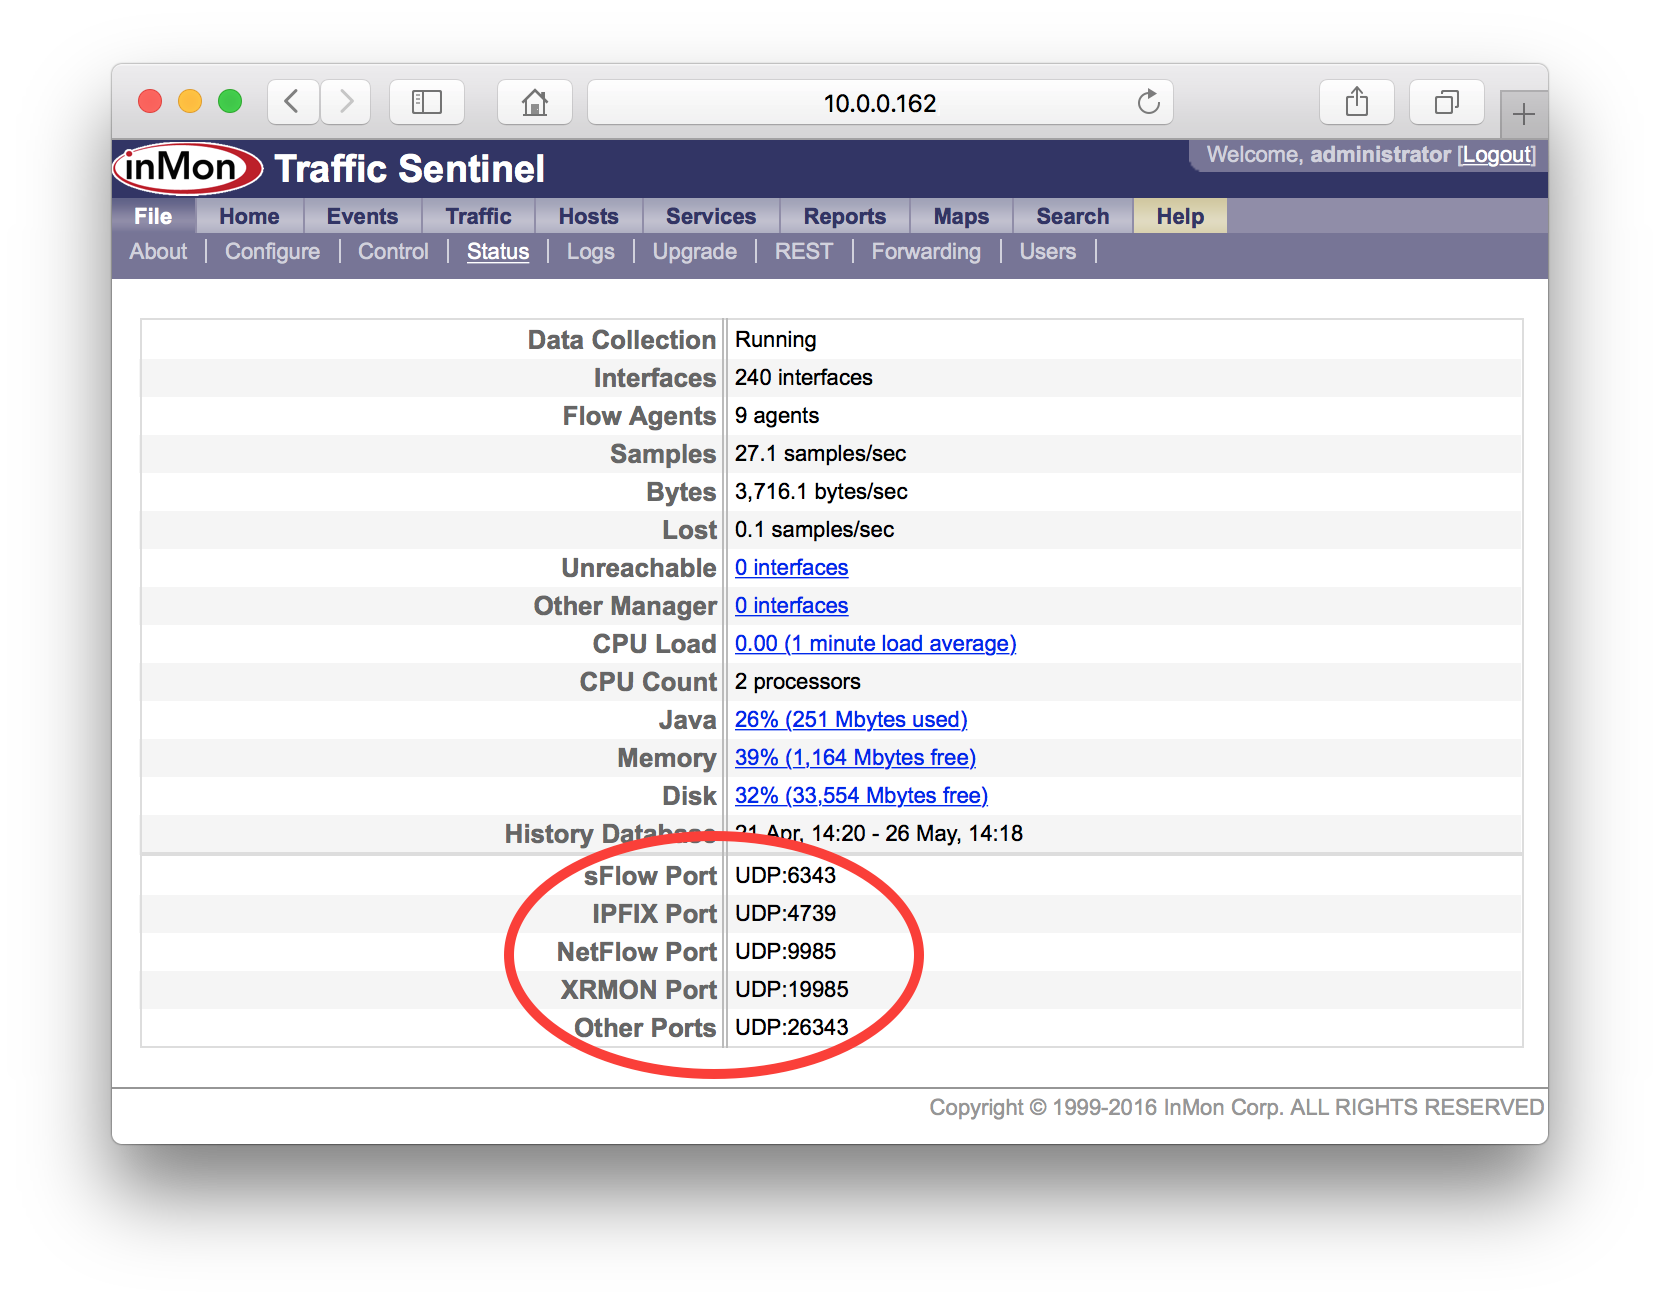
Note: It is important to make sure that any firewalls between Traffic Sentinel and the switches it is monitoring allow passage of packets to these ports. In addition the firewall should allow ICMP echo (ping) packets and SNMP packets (UDP:161).
The following tutorials have more details:
- Tutorial: sFlow Configuration and Troubleshooting
- Tutorial: NetFlow Configuration and Troubleshooting
3. Discover switches
Traffic Sentinel will automatically "discover" devices when it receives sFlow, NetFlow, JFlow or IPFIX data (Note: you would have had to configure the switches to send data to Traffic Sentinel - see 4. Configure switches). If all your devices fall into this category you can skip to section 3.2 Agents.
If you have devices that can only be monitored using SNMP or devices that are going to be configured using SNMP (e.g. sFlow devices supporting the sFlow MIB), then you will need configure Traffic Sentinel's discovery settings before these devices will be discovered. See 3.1 Agent Range below.
3.1 Agent Range
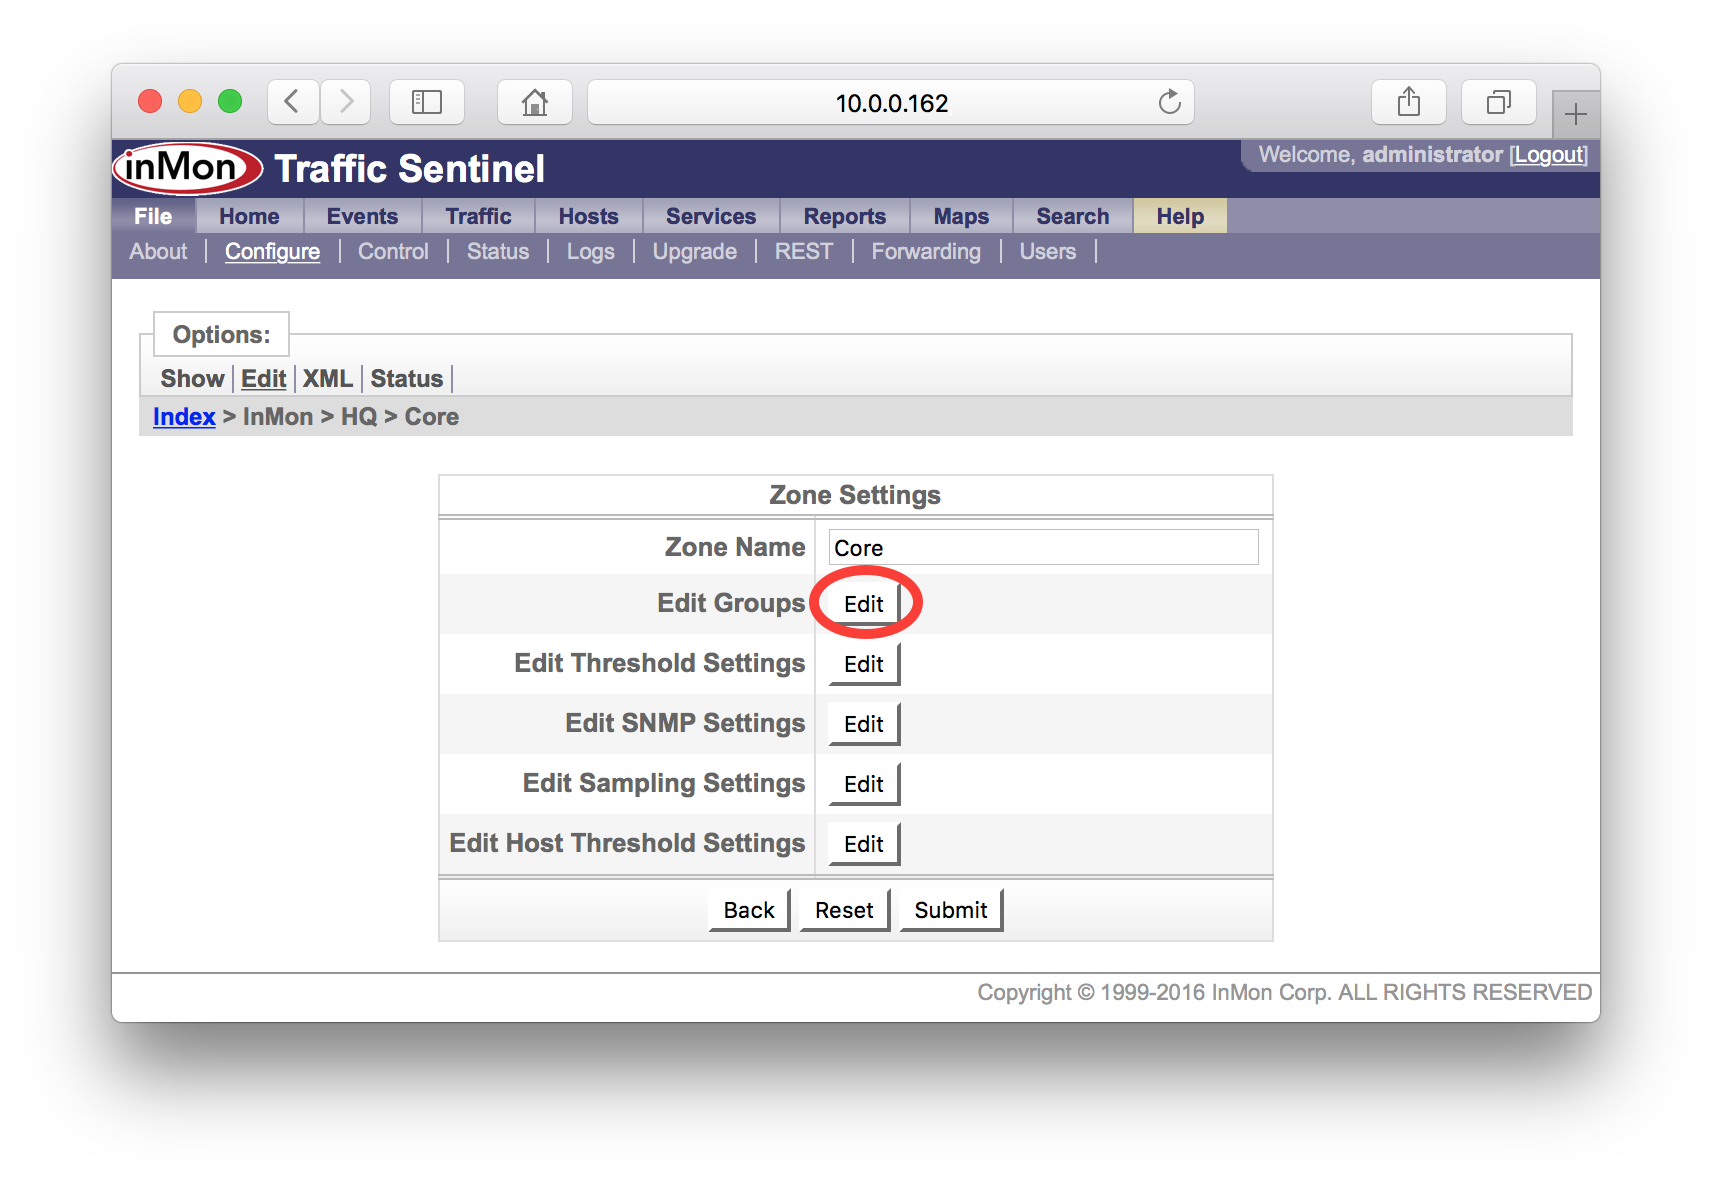
Traffic Sentinel provides a mechanism for scanning ranges of addresses to automatically discover network devices. You will need to edit the network configuration and create an "agent range". First go to the File>Configure>Edit page.
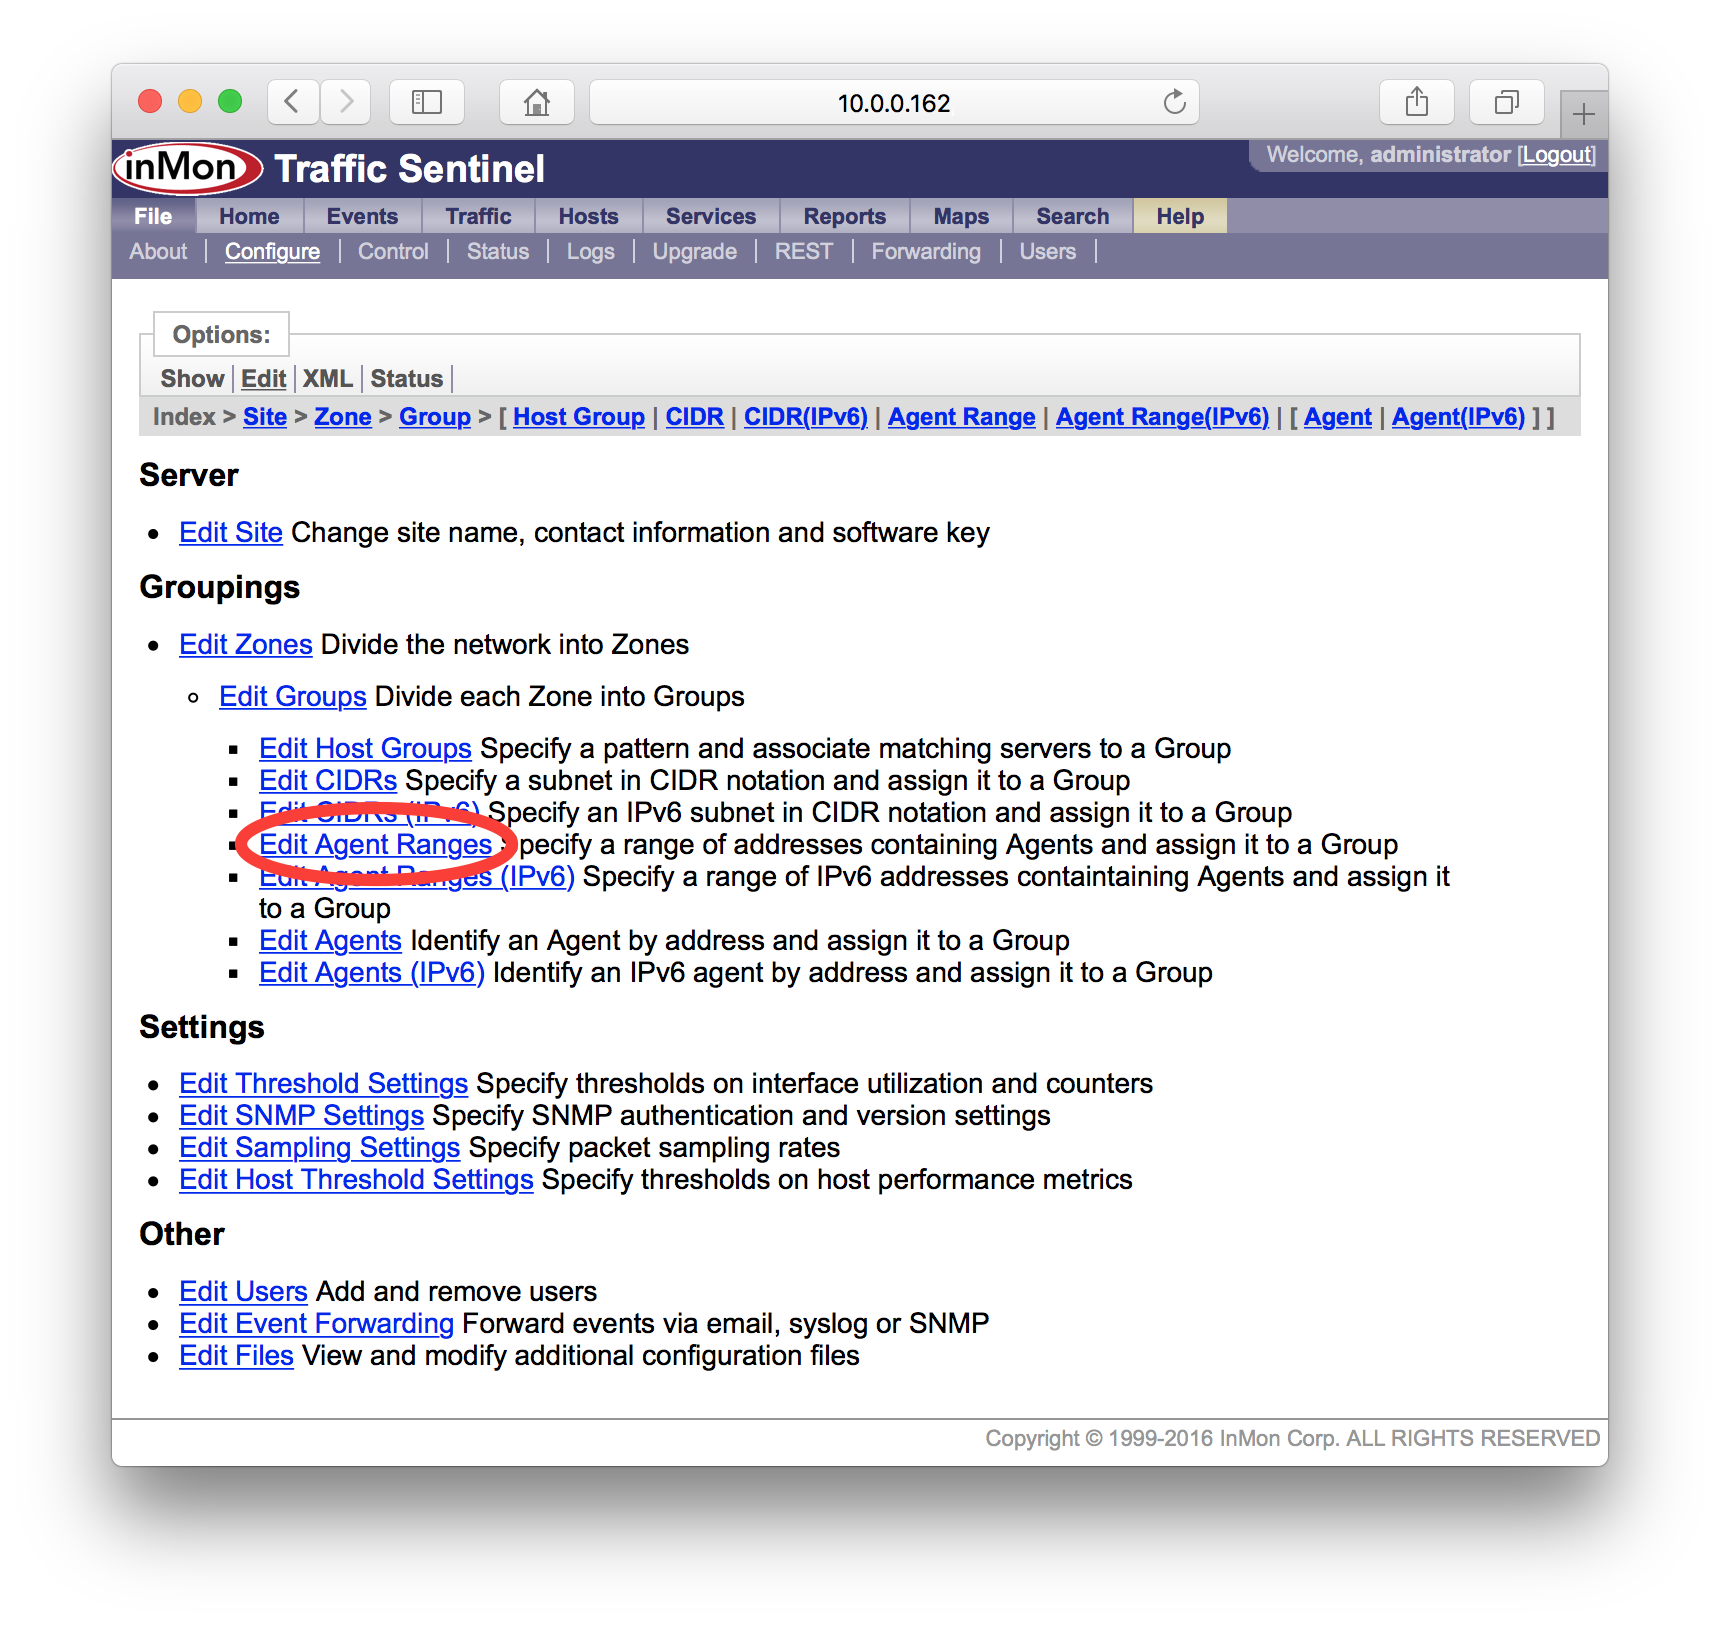
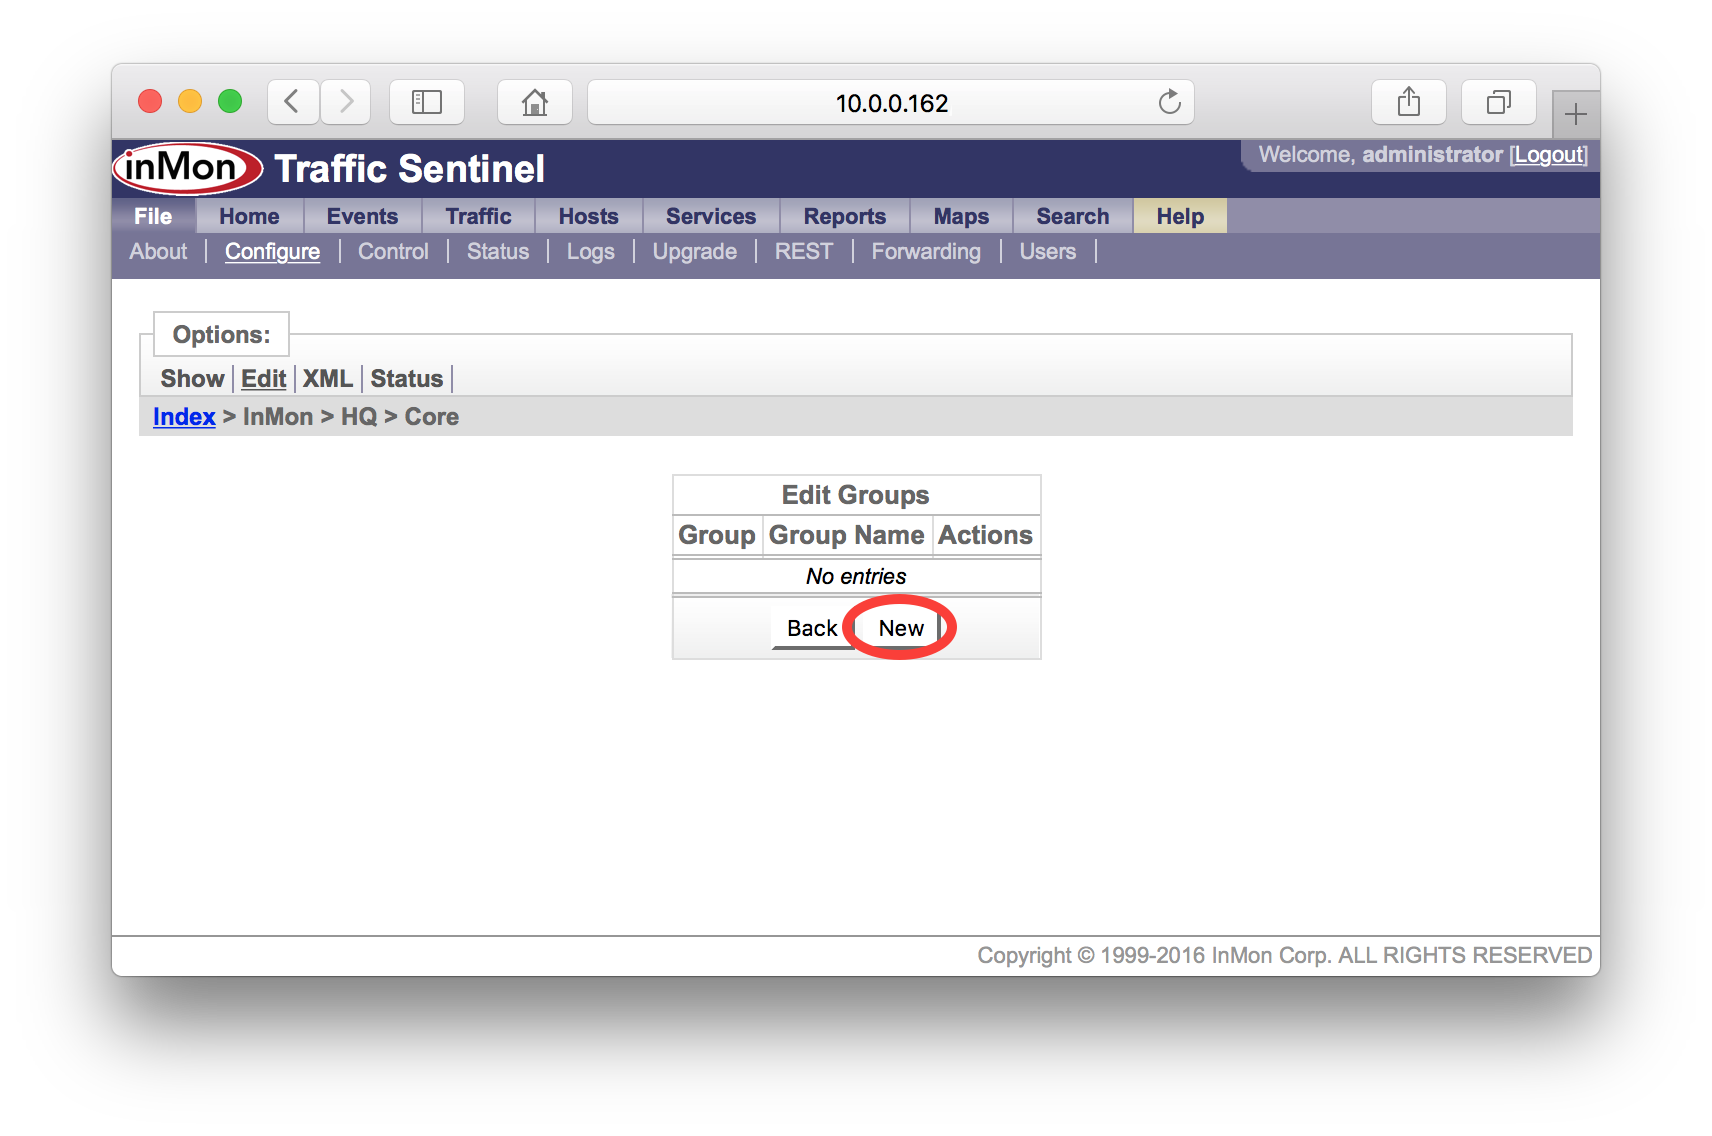
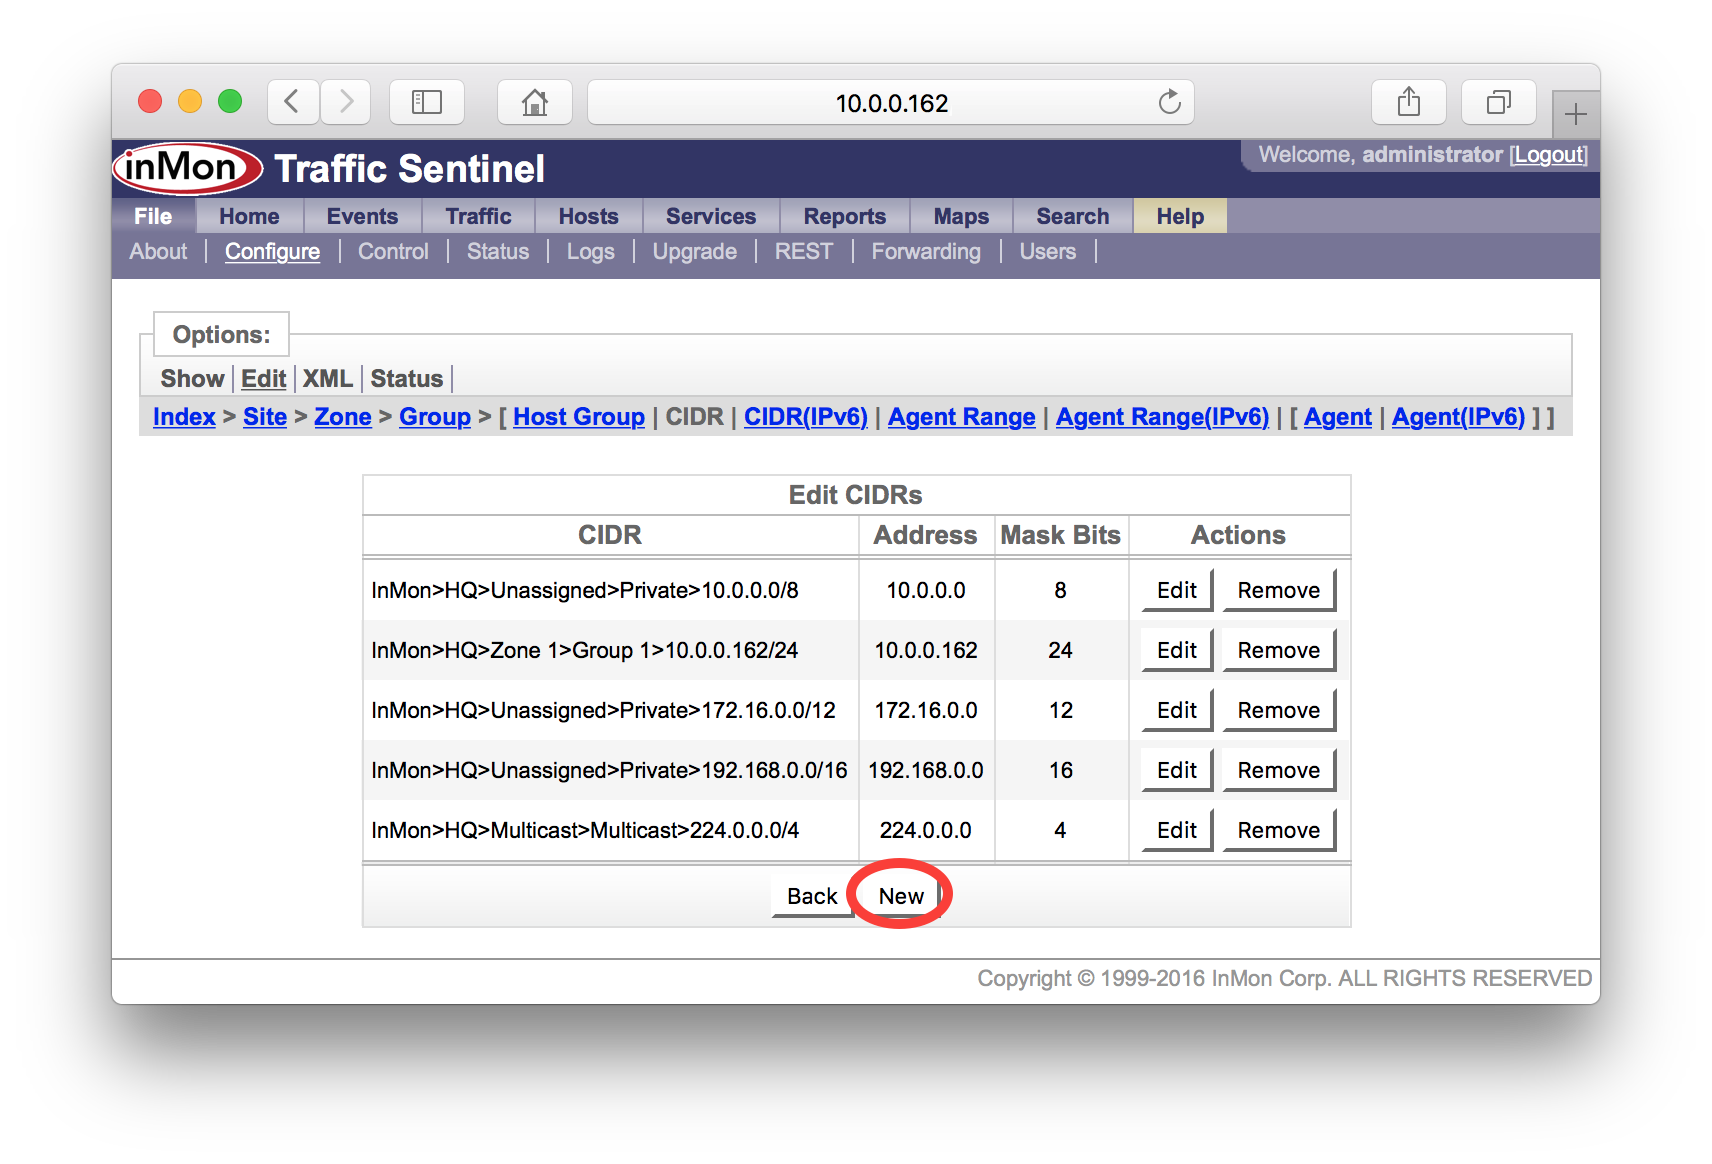
Click on the Edit Agent Ranges link access table of agent ranges.
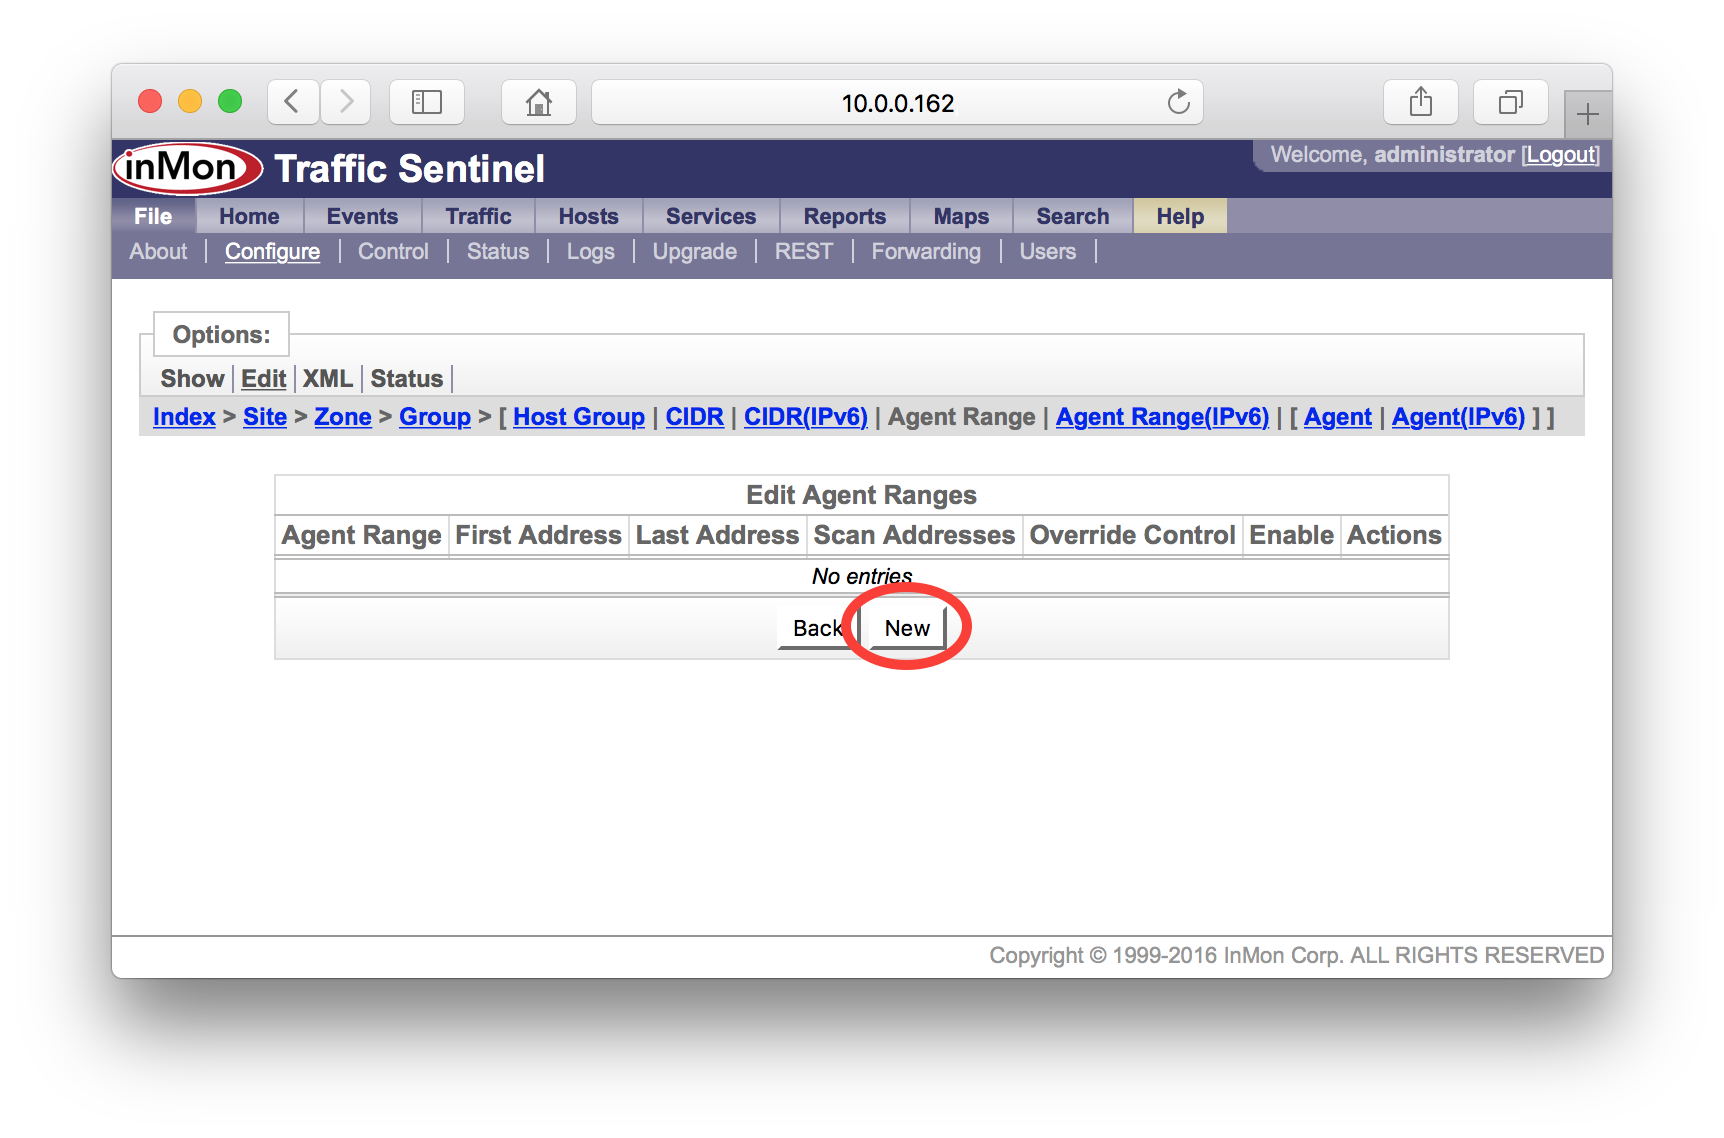
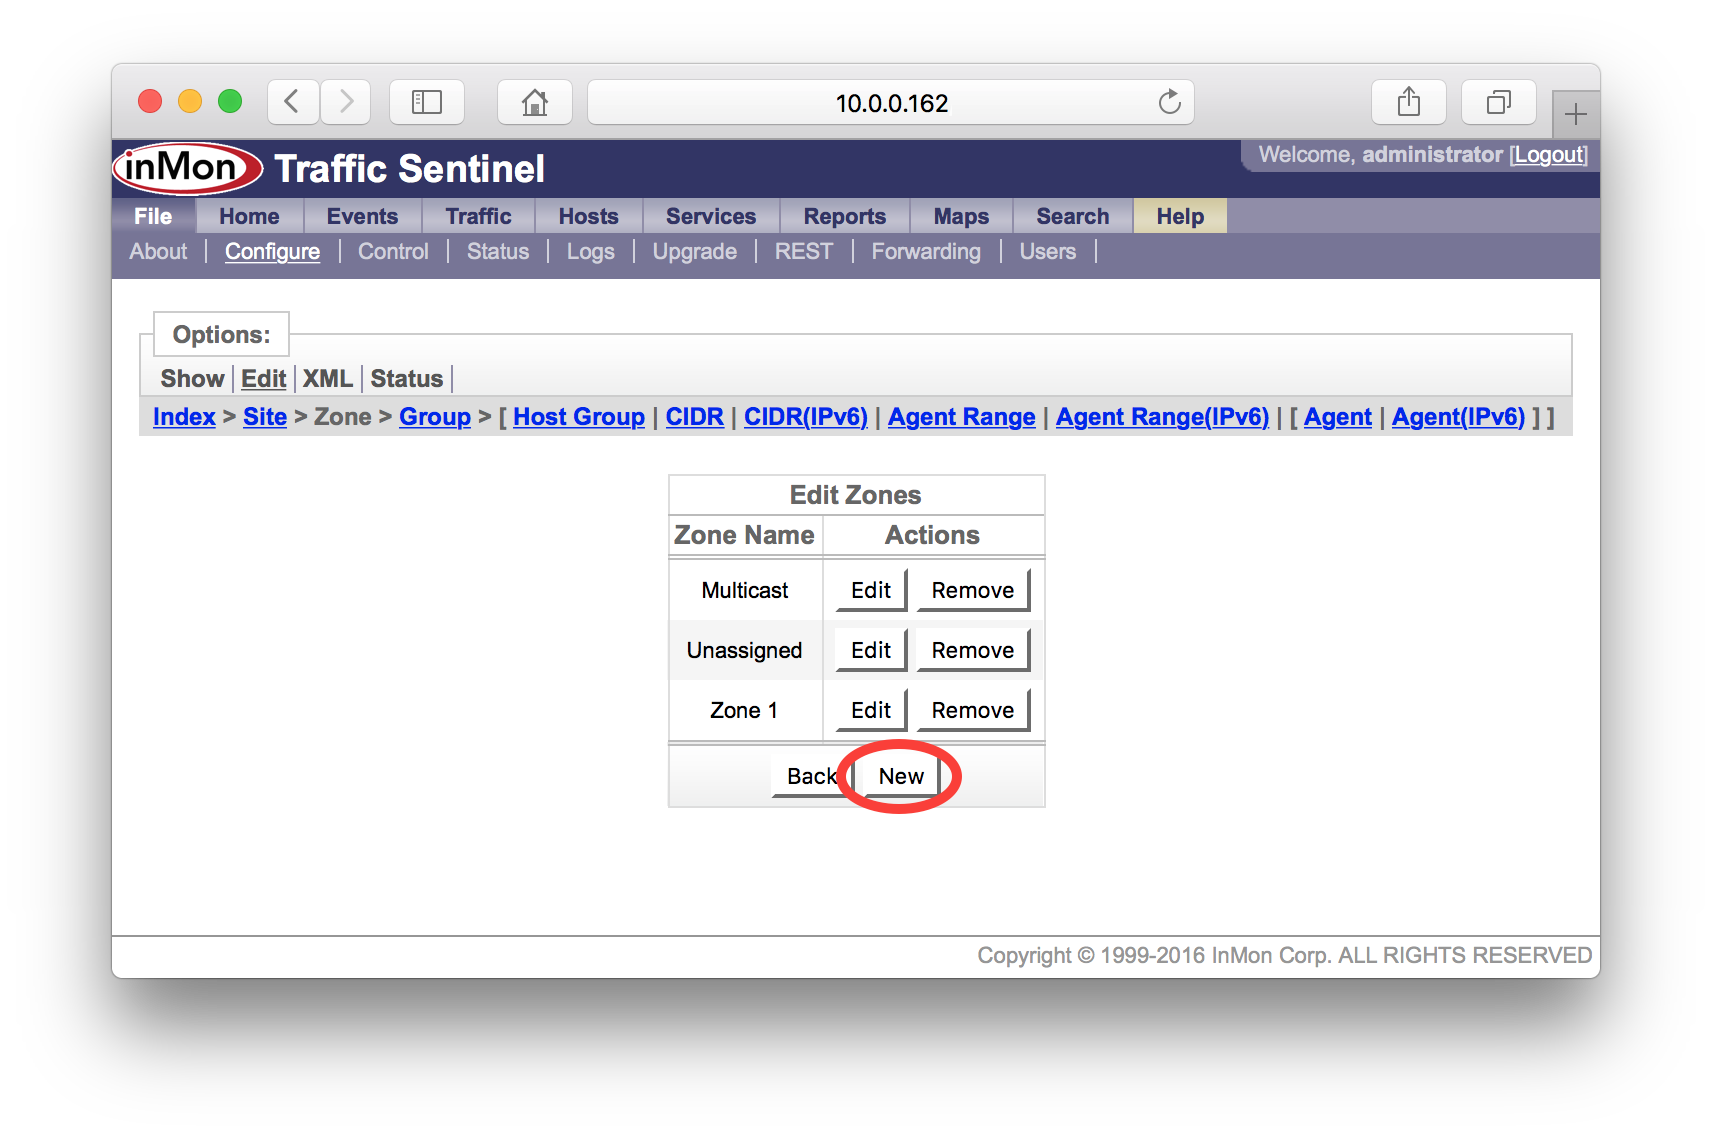
Click on the New button to create a new agent range.
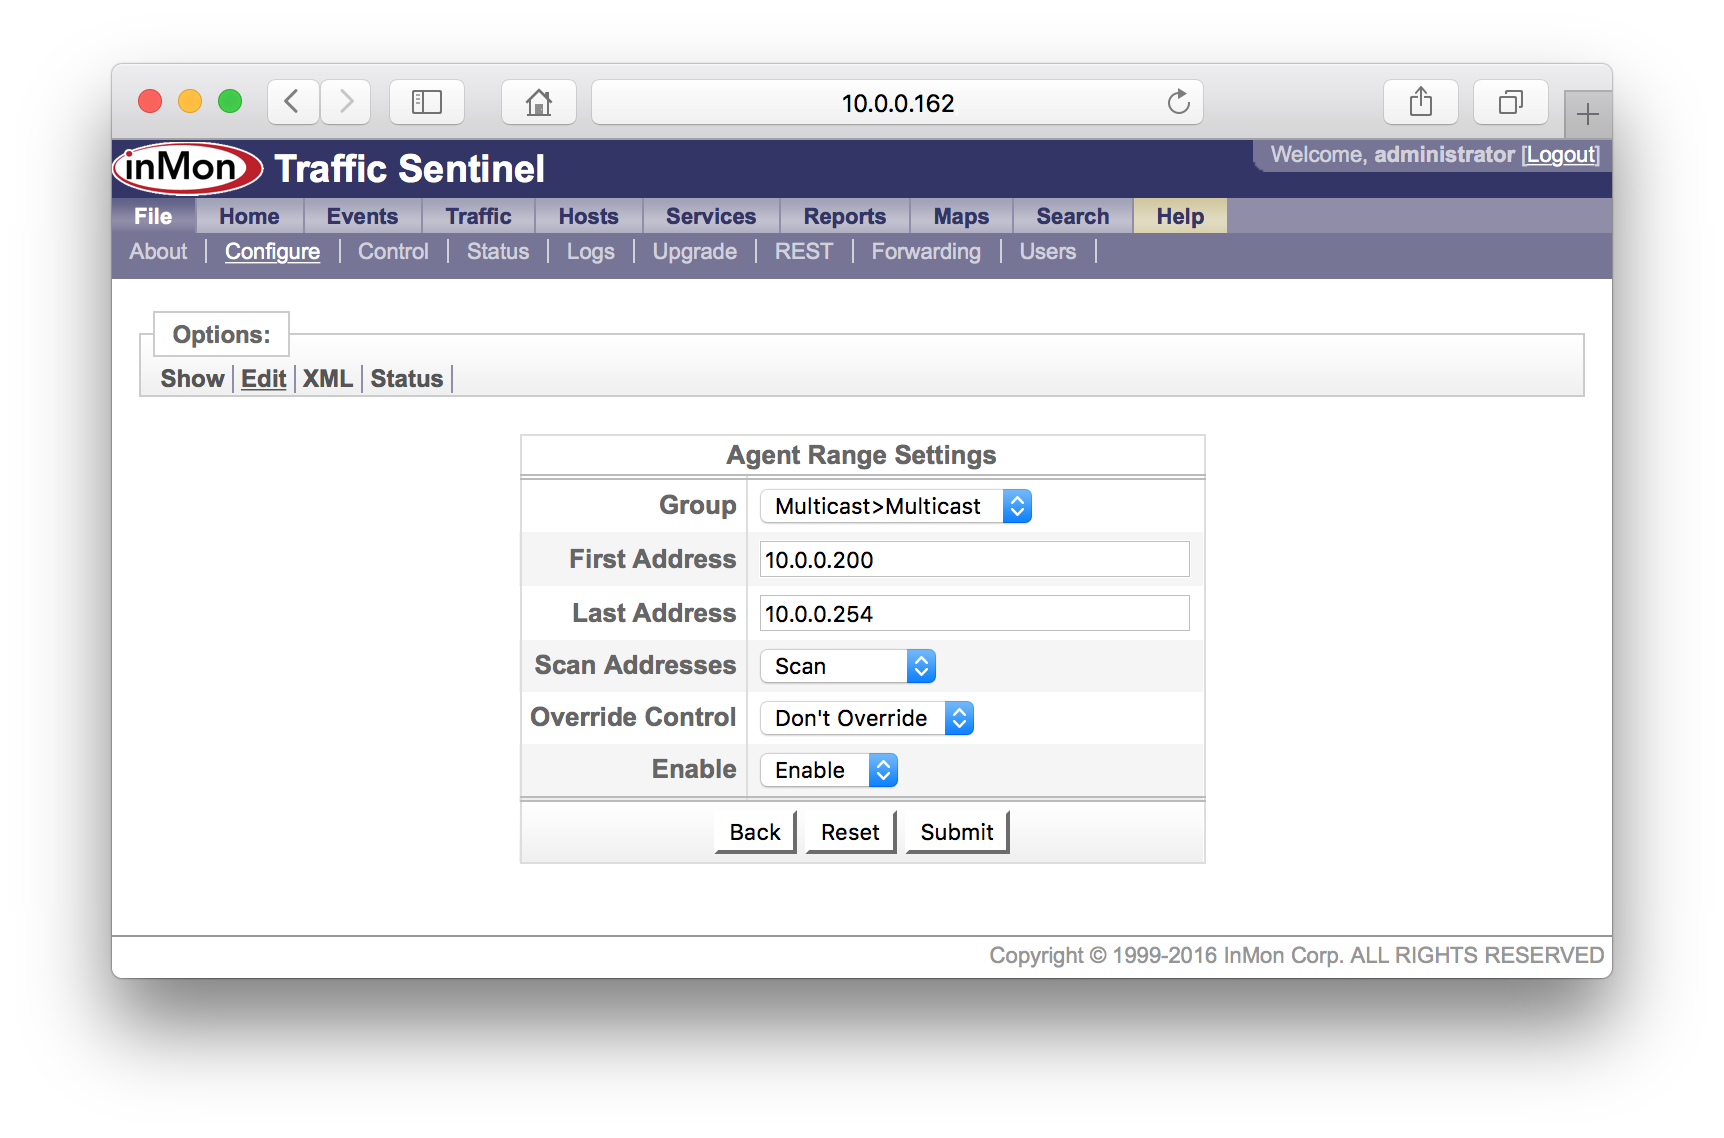
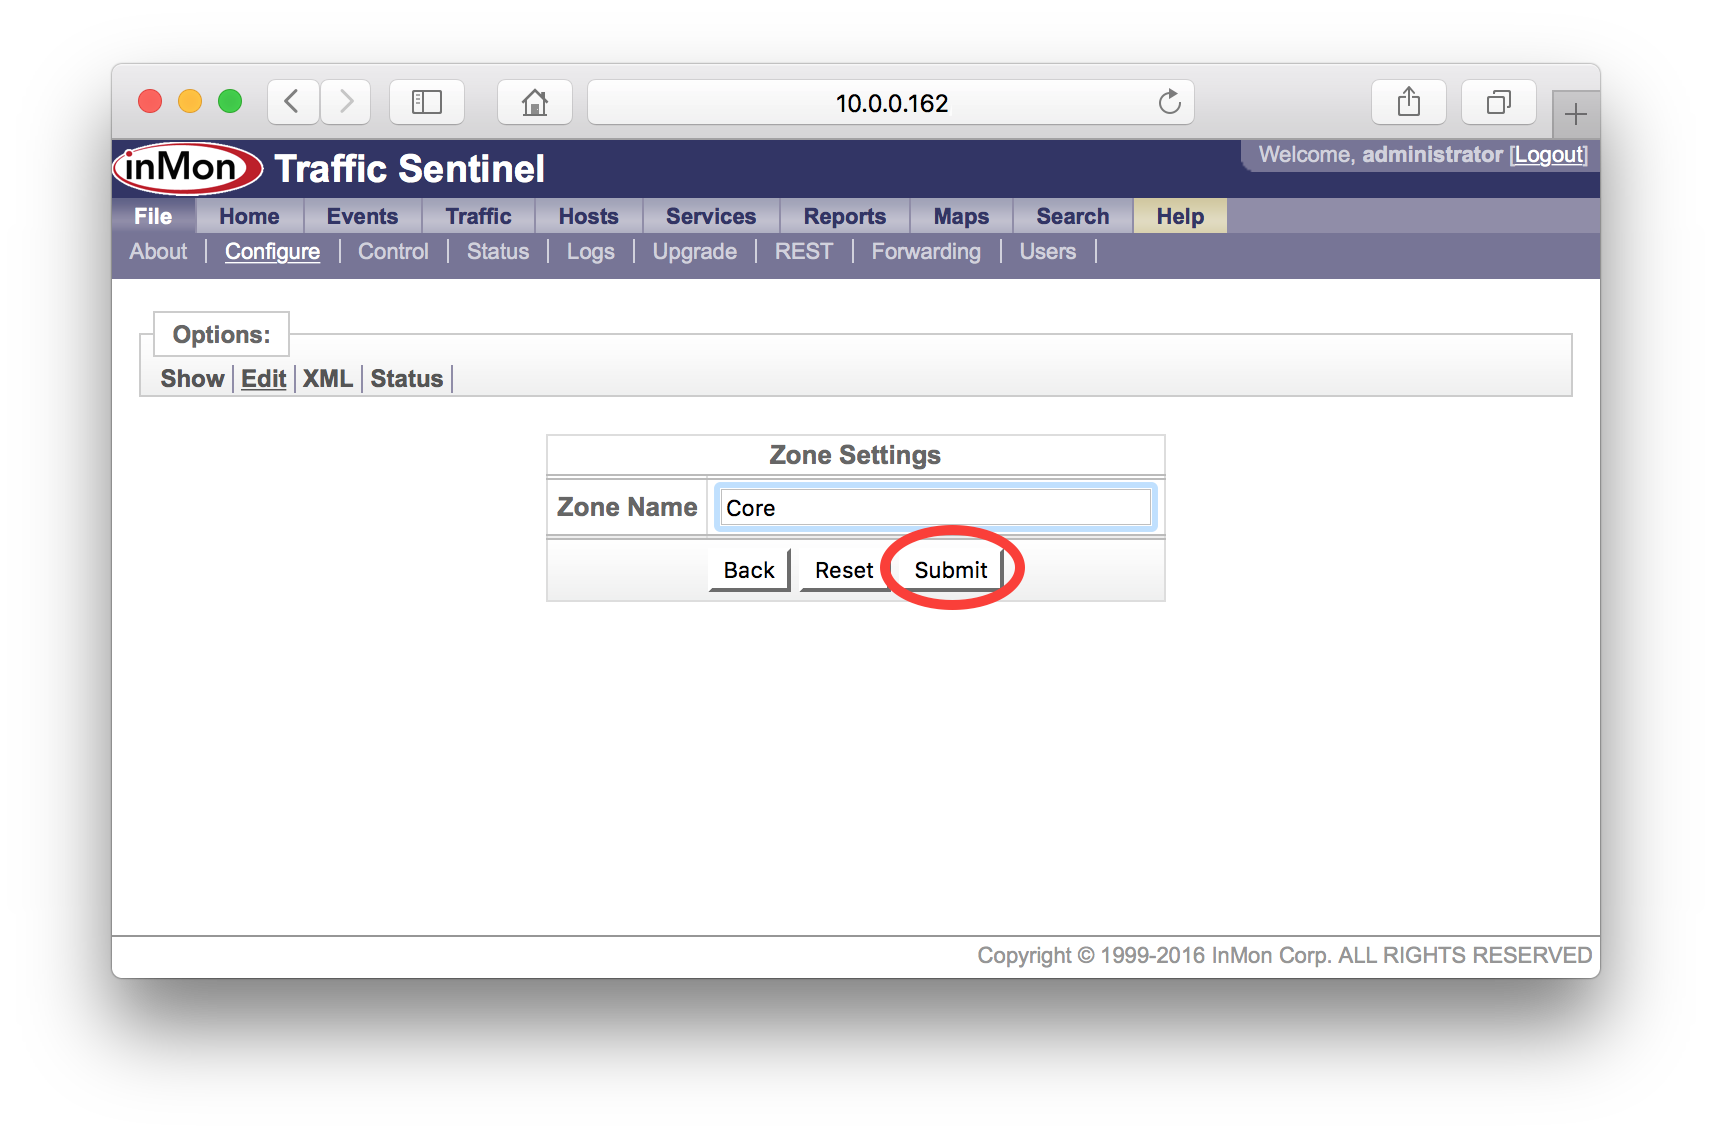
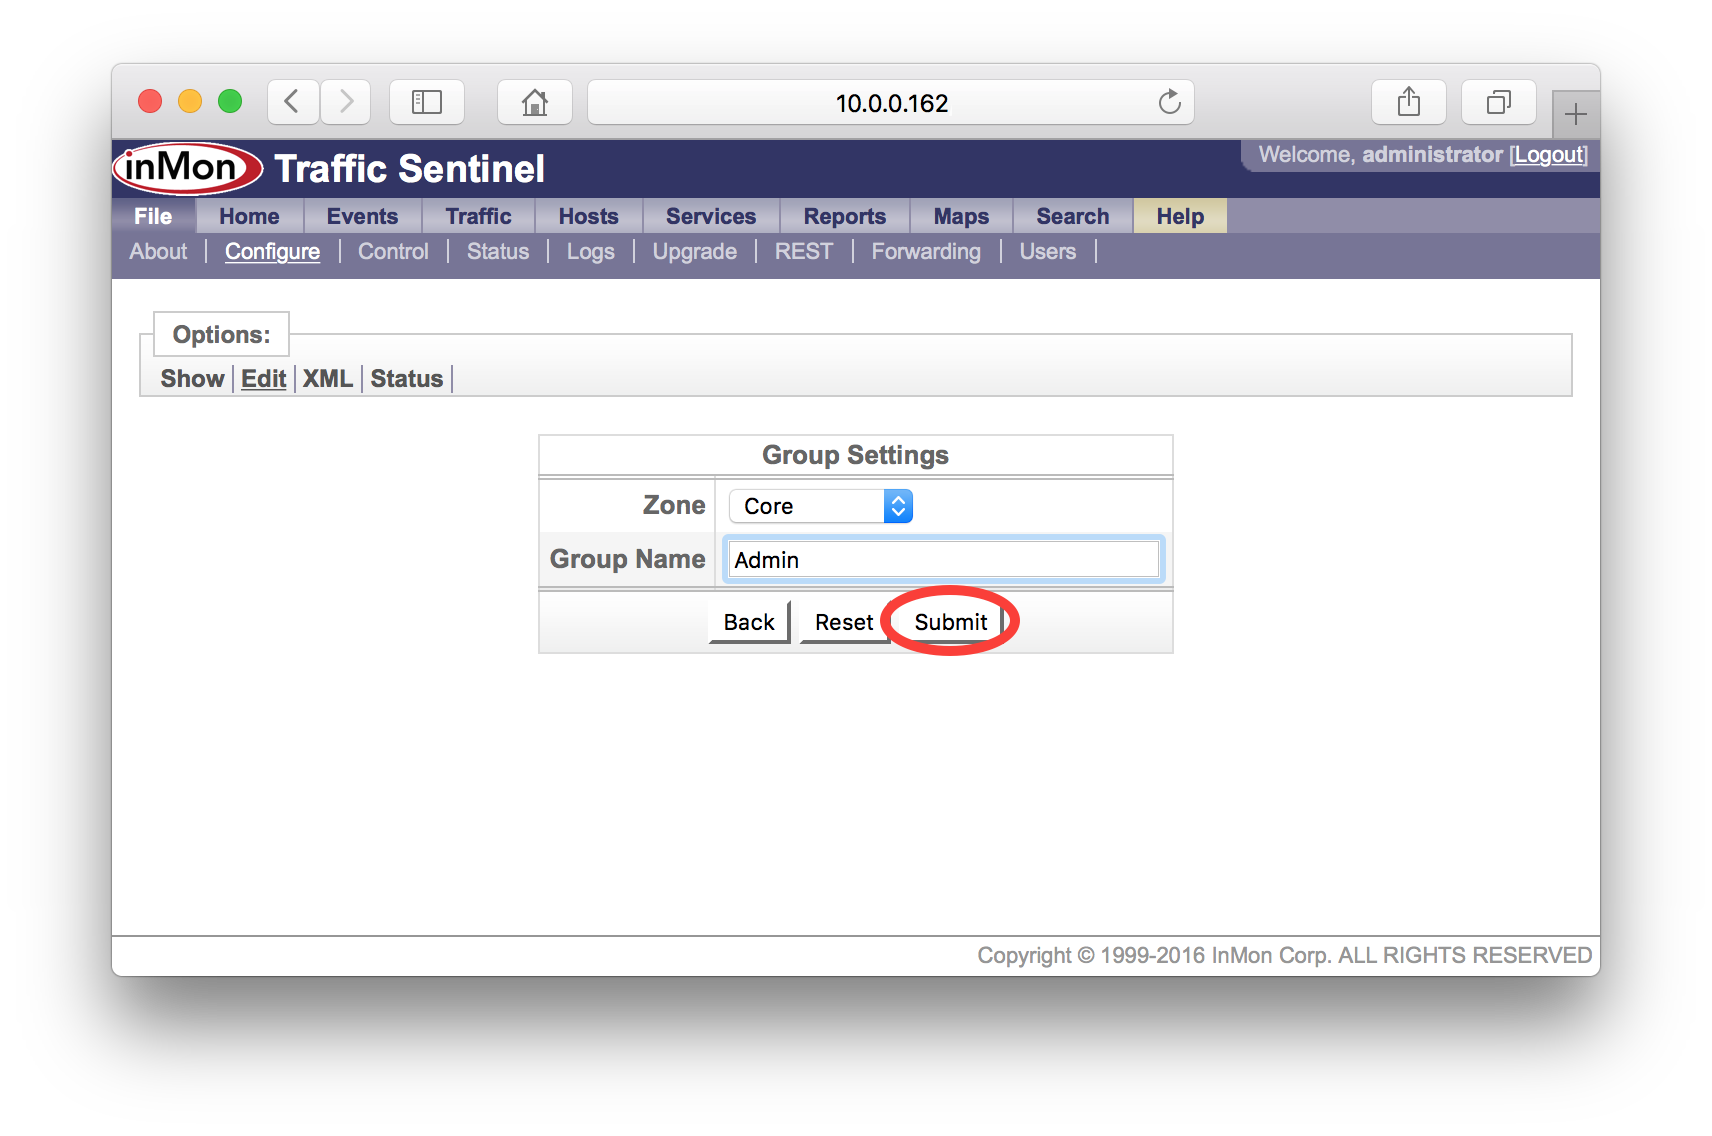
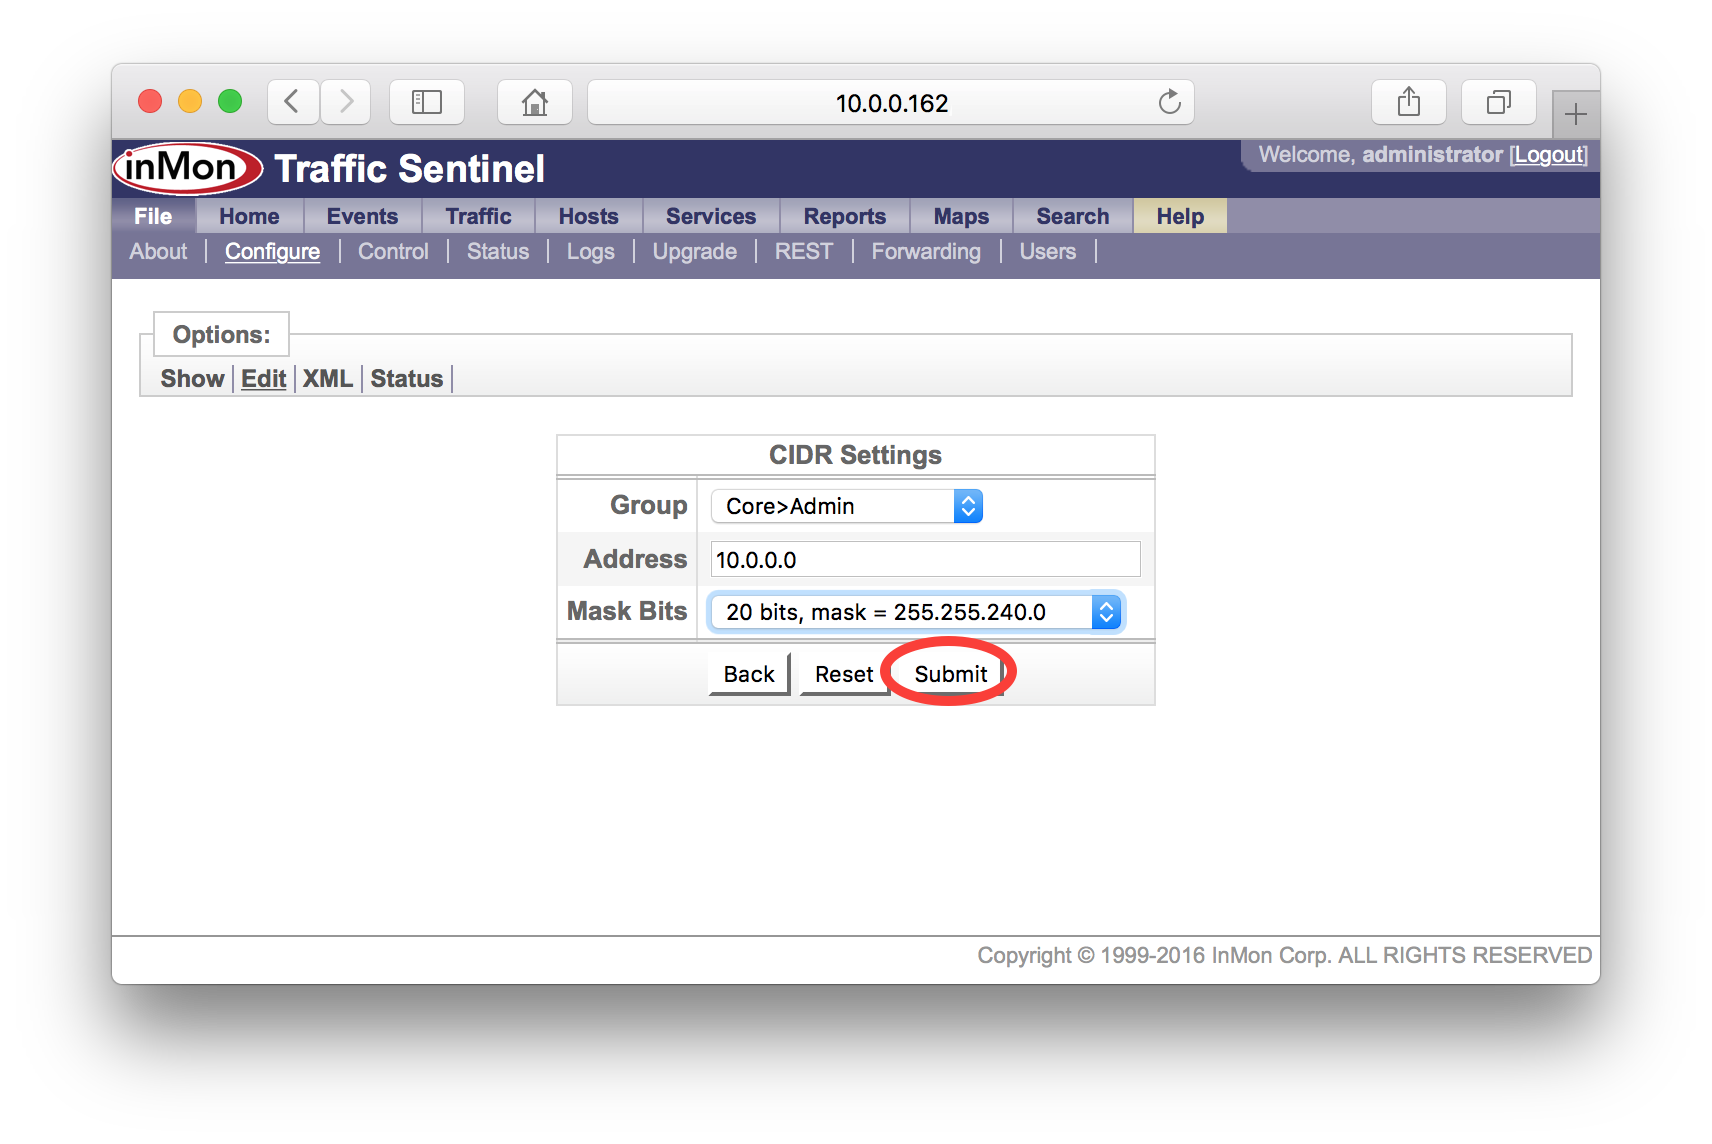
The Agent Range Settings form has the following settings:
- Group The administrative group (see 5. Define administrative groupings). You can leave this setting at its default since you will be defining groups in step 5 and will be able to change the setting then.
- First Address The first address in the range.
- Last Address The last address in the range.
- Scan Addresses Set to Scan to allow Traffic Sentinel to test all the addresses in the range and discover switches.
- Override Control The sFlow MIB has a reservation mechanism that allows a network management application identify settings that it is using and to protect them from changes by other network management applications. Normally the settings Don't Override is appropriate since this respects the settings made by other applications. If Traffic Sentinel is the only application being used to collect sFlow data then you might want to set this value to Override, ensuring that Traffic Sentinel will be able to take over whatever resources it need to monitor the network.
- Enable/Disable Set this value to Enable to allow the address range to be scanned and to allow monitoring of Agents that fall into this range. Set to Disable if you want to block monitoring of Agents in this range.
In this example, switches are allocated addresses in the range 10.0.0.200 to 10.0.0.254. The form shows the settings needed to scan this range for agents.
3.2 Agents
Traffic Sentinel identifies each switch or router by a unique IP address or "Agent" address. The term "Agent" commonly refers to the software entity on a managed switch or router that is responsible for handling SNMP requests. Traffic Sentinel uses the term to refer to any device that it is monitoring.
A device may have many IP addresses associated with it. For example, a router will typically have an IP address associated with each routed interface. The following rules determine which IP address will be used as the unique Agent address:
- SNMP Traffic Sentinel uses SNMP to obtain information about agents. Unlike sFlow, NetFlow and IPFIX which stream information from the switch to Traffic Sentinel; SNMP information must be explicitly requested by Traffic Sentinel. The agent address will either be defined in the Traffic Sentinel configuration file, or determined by sFlow, NetFlow or IPFIX.
- sFlow The sFlow protocol explicitly assigns a unique agent address to each device. The "sFlow Agent Address" can usually be displayed using command line "show" commands and is accessible as part of the sFlow SNMP MIB. The agent address is typically the IP loopback address for the device.
- NetFlow The NetFlow protocol does not provide an explicit agent address. Traffic Sentinel will simply use the source IP address from the NetFlow datagrams it recieves as the agent address.
- JFlow The JFlow protocol does not provide an explicit agent address. Traffic Sentinel will simply use the source IP address from the JFlow datagrams it recieves as the the agent address.
- IPFIX Like NetFlow, the IPFIX protocol does not have an explicit agent address. Traffic Sentinel will simply use the source IP address from the IPFIX datagrams it receives as the agent address.
The File>Configure>Status page shows all the agents that have been discovered and their place in the configuration tree. Section 5. Define administrative groupings describes the rules for locating an agent in the configuration tree.
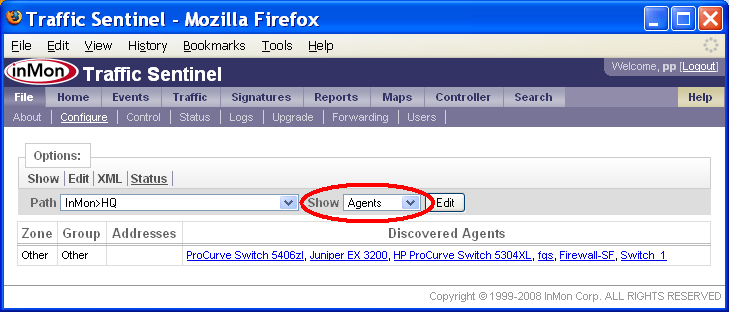
In this example, there are 6 switches located with Zone and Group "Other", indicating that we haven't yet organized the network into Zones and Groups (see 5. Define administrative groupings).
To see the addresses instead of names, change the Show setting to Addresses.
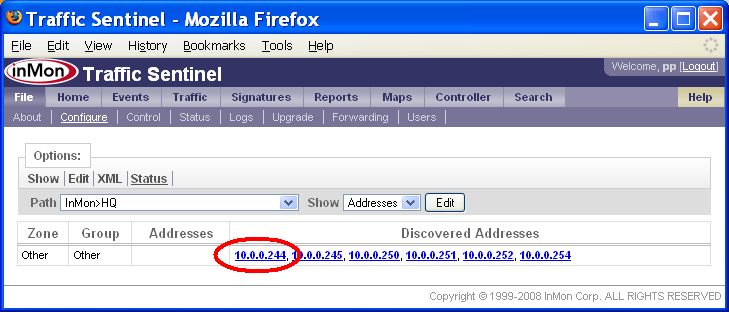
This view shows addresses that have been discovered. If the address is in bold then it is the Agent address, otherwise it is another of the addresses associated with the Agent.
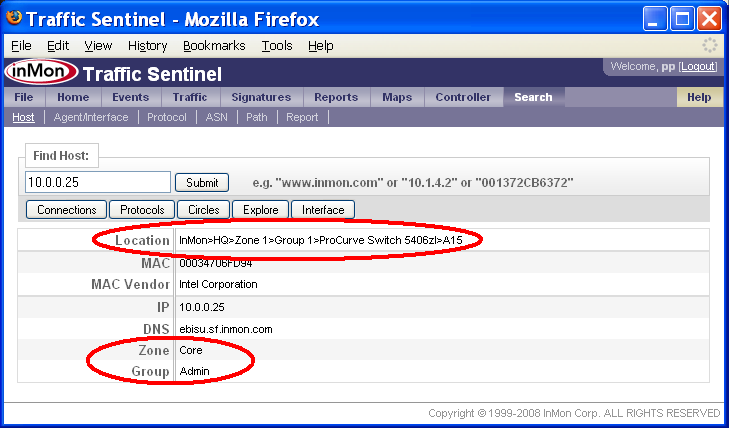
Click on links in Discovered Agents or Discovered Addresses to see details about the Agent. The following screen shows information relating to the 10.0.0.244 address.
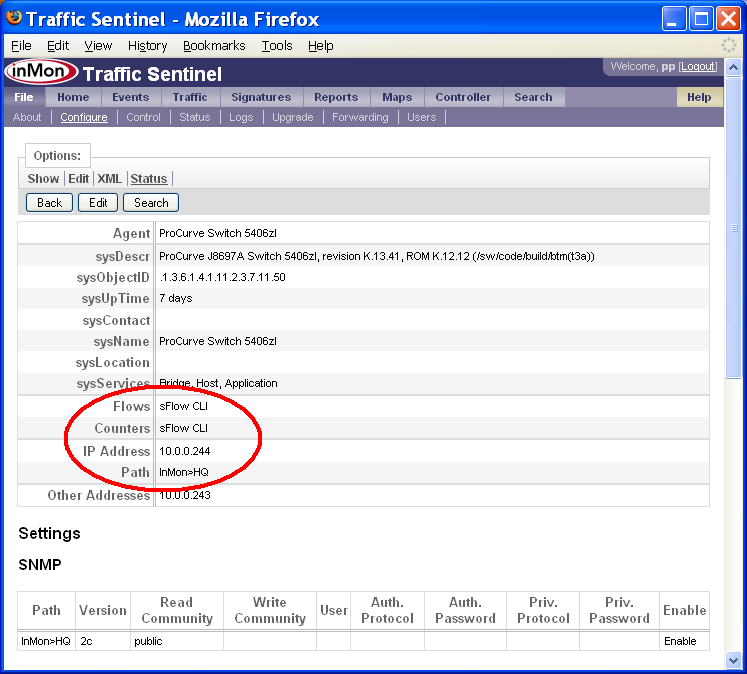
In this case the IP Address (Agent address) is 10.0.0.244 and Traffic Sentinel is applying configuration settings from the Path for the site (i.e. InMon>HQ). Clicking on the Edit button at the top of the screen will open the configuration editor to the correct path for the agent so that its settings can be changed.
The Flows and Counters values are sFlow CLI, indicating that Traffic Sentinel is receiving interface counters and traffic flow information through CLI configured sFlow.
The Settings sections on this page show all the settings that are being applied to this agent. You can see that the SNMP community string "public" is being used for SNMP requests.
If want to find an agent you can use the Search>Agent/Interface page to find the agent using any of its addresses, its name or its description. The following example shows the result of searching for an agent using the address 10.0.0.243.
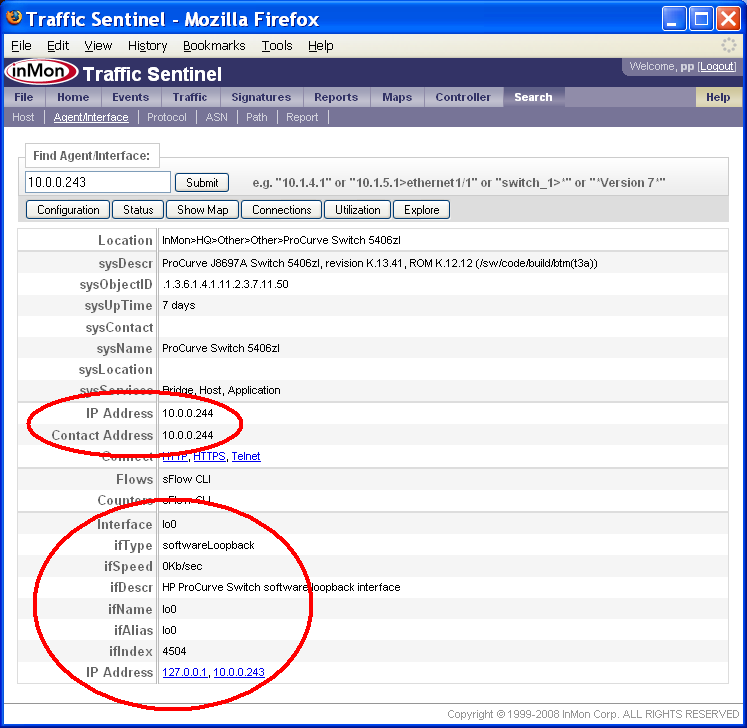
This page shows that the IP Address (Agent address) is 10.0.0.244 (Note: this is the same agent we looked at before. If you go back to the previous screen you will notice that 10.0.0.243 appears in the Other Addresses list for agent 10.0.0.244).
The Contact Address is the address that is used to communicate with the agent. In this case the Contact Address and the IP Address are the same, but this is not always the case. If the IP Address is unreachable from Traffic Sentinel, another of the agent's addresses may be used as the Contact Address.
The address 10.0.0.243 that we searched for is associated with the loopback interface, lo0 on the switch.
Finally, when new agents are discovered and informational event is generated in the event log:
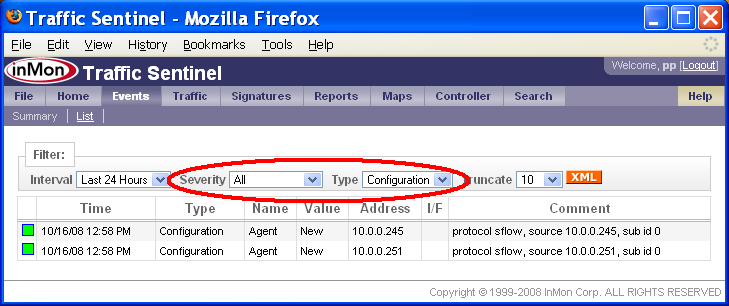
The Events>List page shows recent events. Setting the Severity to All and the Type to Configuration will show recent configuration changes and new or removed agents. In this example, two new agents have been found in the last 24 hours, agents 10.0.0.245 and 10.0.0.251.
4. Confirm traffic measurements
The Traffic>Status page is the best place to confirm that traffic data is being received and to identify problems.
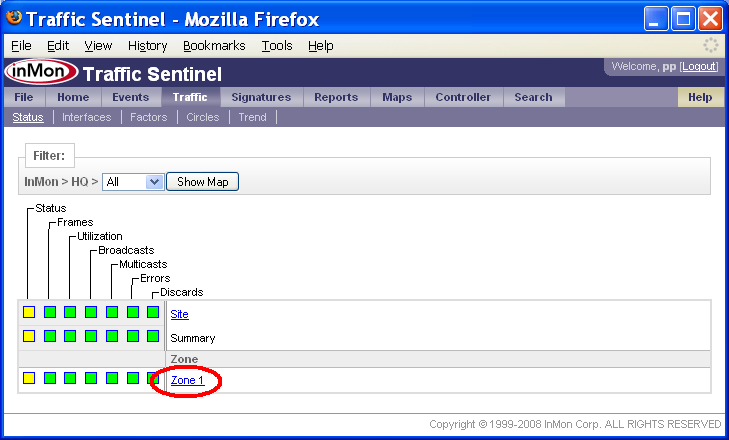
The top level view shows the Zones that contain Groups of switches (see 5. Define administrative groupings). In this case click on the default zone name "Zone 1".

There is only one group defined, the default group "Group 1". Click on the group name to see the switches it contains.
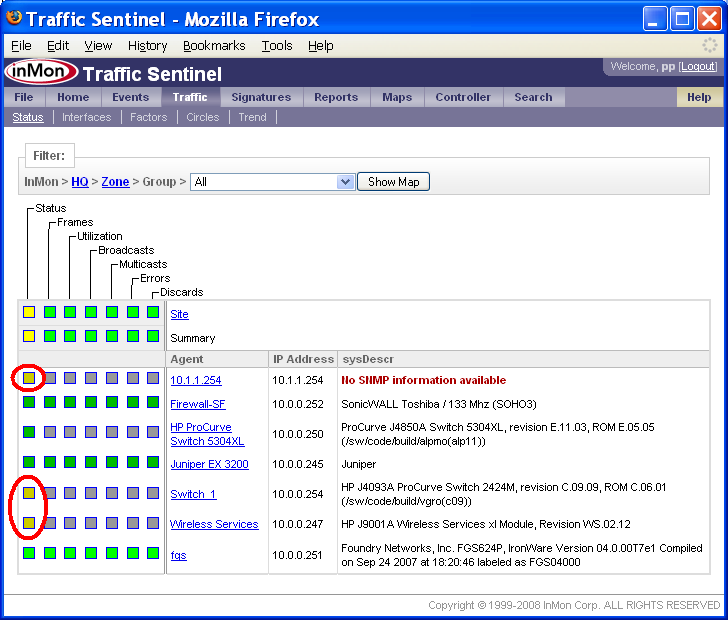
The table shows the 7 switches in the selected group. The grid of colored boxes indicates the status of each switch. Shade is used to indicate whether flow information is being collected for the device (flow information is used to determine which connections are generating traffic).
| Flows=No | Flows=Yes | Description |
|---|---|---|
| Unknown There is no status value, either because no counter data is available, or because there are no thresholds set. | ||
| Good Counter value does not exceed threshold value. | ||
| Warn Counter has exceeded threshold value in at least once, but not enough times to cause an alert. | ||
| Critical Counter has exceeded threshold value often enough to generate an alert. |
The circled "marginal" boxes ![]() in
the Agent status column should be investigated further.
in
the Agent status column should be investigated further.
The first agent, 10.1.1.254, has the message No SNMP information available indicating that
there is a problem with obtaining SNMP information. Clicking on the circled
status box ![]() gives the following information:
gives the following information:
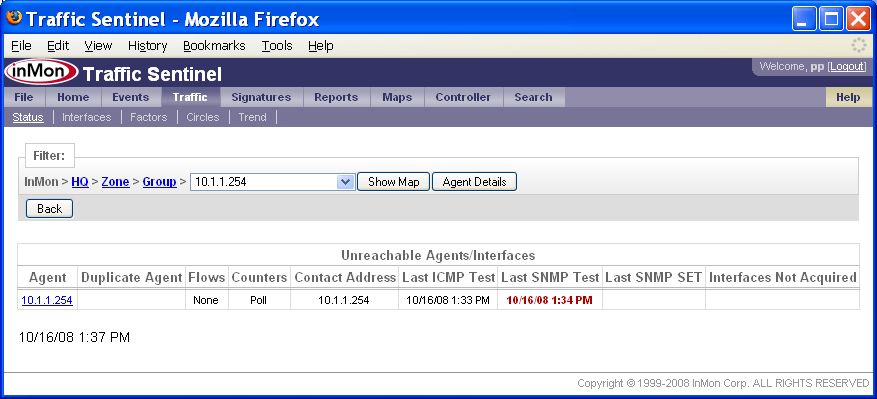
This table indicates that the agent exists (since it responds to ICMP Test, "ping" test messages), but fails to respond to SNMP tests messages. SNMP communication problems can be caused because the Traffic Sentinel SNMP configuration settings are incorrect for this switch, or because the switch is not permitting SNMP requests from Traffic Sentinel.
Clicking on the second circled status box, corresponding to the agent 10.0.0.254 gives the following information:
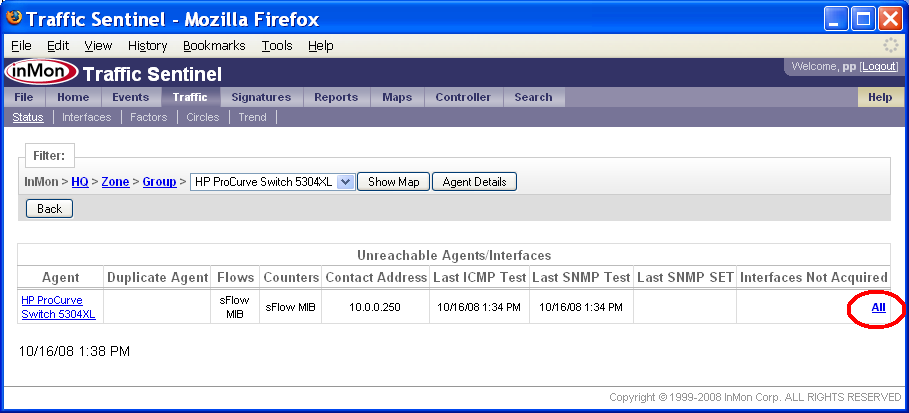
In this case the Flows and Counters columns indicate that Traffic Sentinel is attempting to use the sFlow MIB to configure sFlow monitoring for the agent. The ICMP and SNMP tests are successful, but Interfaces Not Aquired indicates that All switch interfaces were already being monitored by other network applications and were not available to Traffic Sentinel. Clicking on the All link gives the following information:
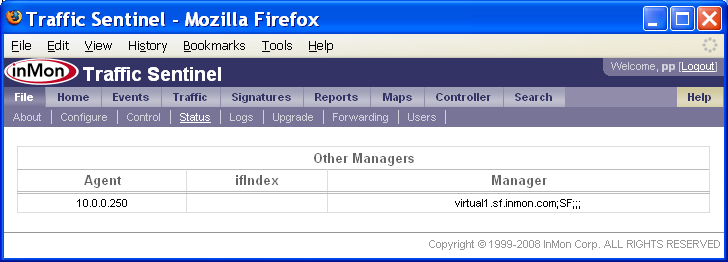
The Manger value of virtual1.sf.inmon.com;SF;;; indicates that the sFlow agent is already in use by software running on virtual1.sf.inmon.com. The monitor on virtual1.sf.inmon.com should be configured to release this agent so that it can be acquired by Traffic Sentinel.
Clicking on the third circled status box, corresponding to agent 10.0.0.247, gives the following information:
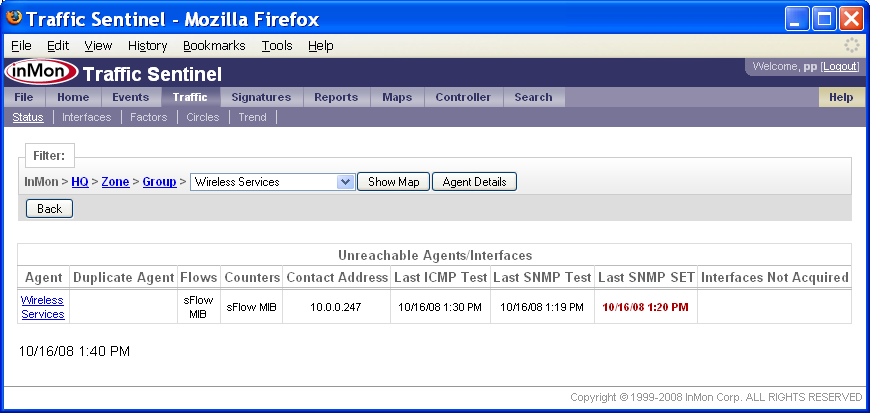
In this case the Flows and Counters columns indicate that Traffic Sentinel is attempting to use the sFlow MIB to configure sFlow monitoring for the agent. The ICMP and SNMP tests were successful, but the SNMP SET test failed. Configuring sFlow via the sFlow MIB requires that Traffic Sentinel have SNMP read/write access (i.e. it must be able to perform SNMP SET operations). The failed SNMP SET test indicates that either the switch hasn't been configured to allow SET operations, or Traffic Sentinel hasn't been given the correct SNMP configuration to perform SET operations. Traffic Sentinel does have SNMP read access (shown by the successful SNMP test).
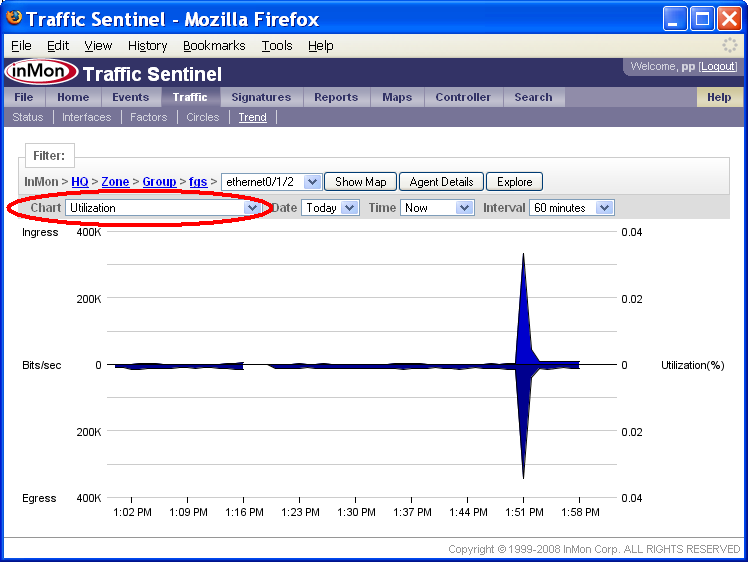
Once the communication issues have been resolved, the availability of counter and flow information can be verified using the Traffic>Trend page.
The agent fgs had a status color ![]() indicating that flow and counter information is available. Selecting an interface, ethernet0/1/2, on this switch and selecting the Utilization shows that
counter information is indeed being collected for this switch.
indicating that flow and counter information is available. Selecting an interface, ethernet0/1/2, on this switch and selecting the Utilization shows that
counter information is indeed being collected for this switch.
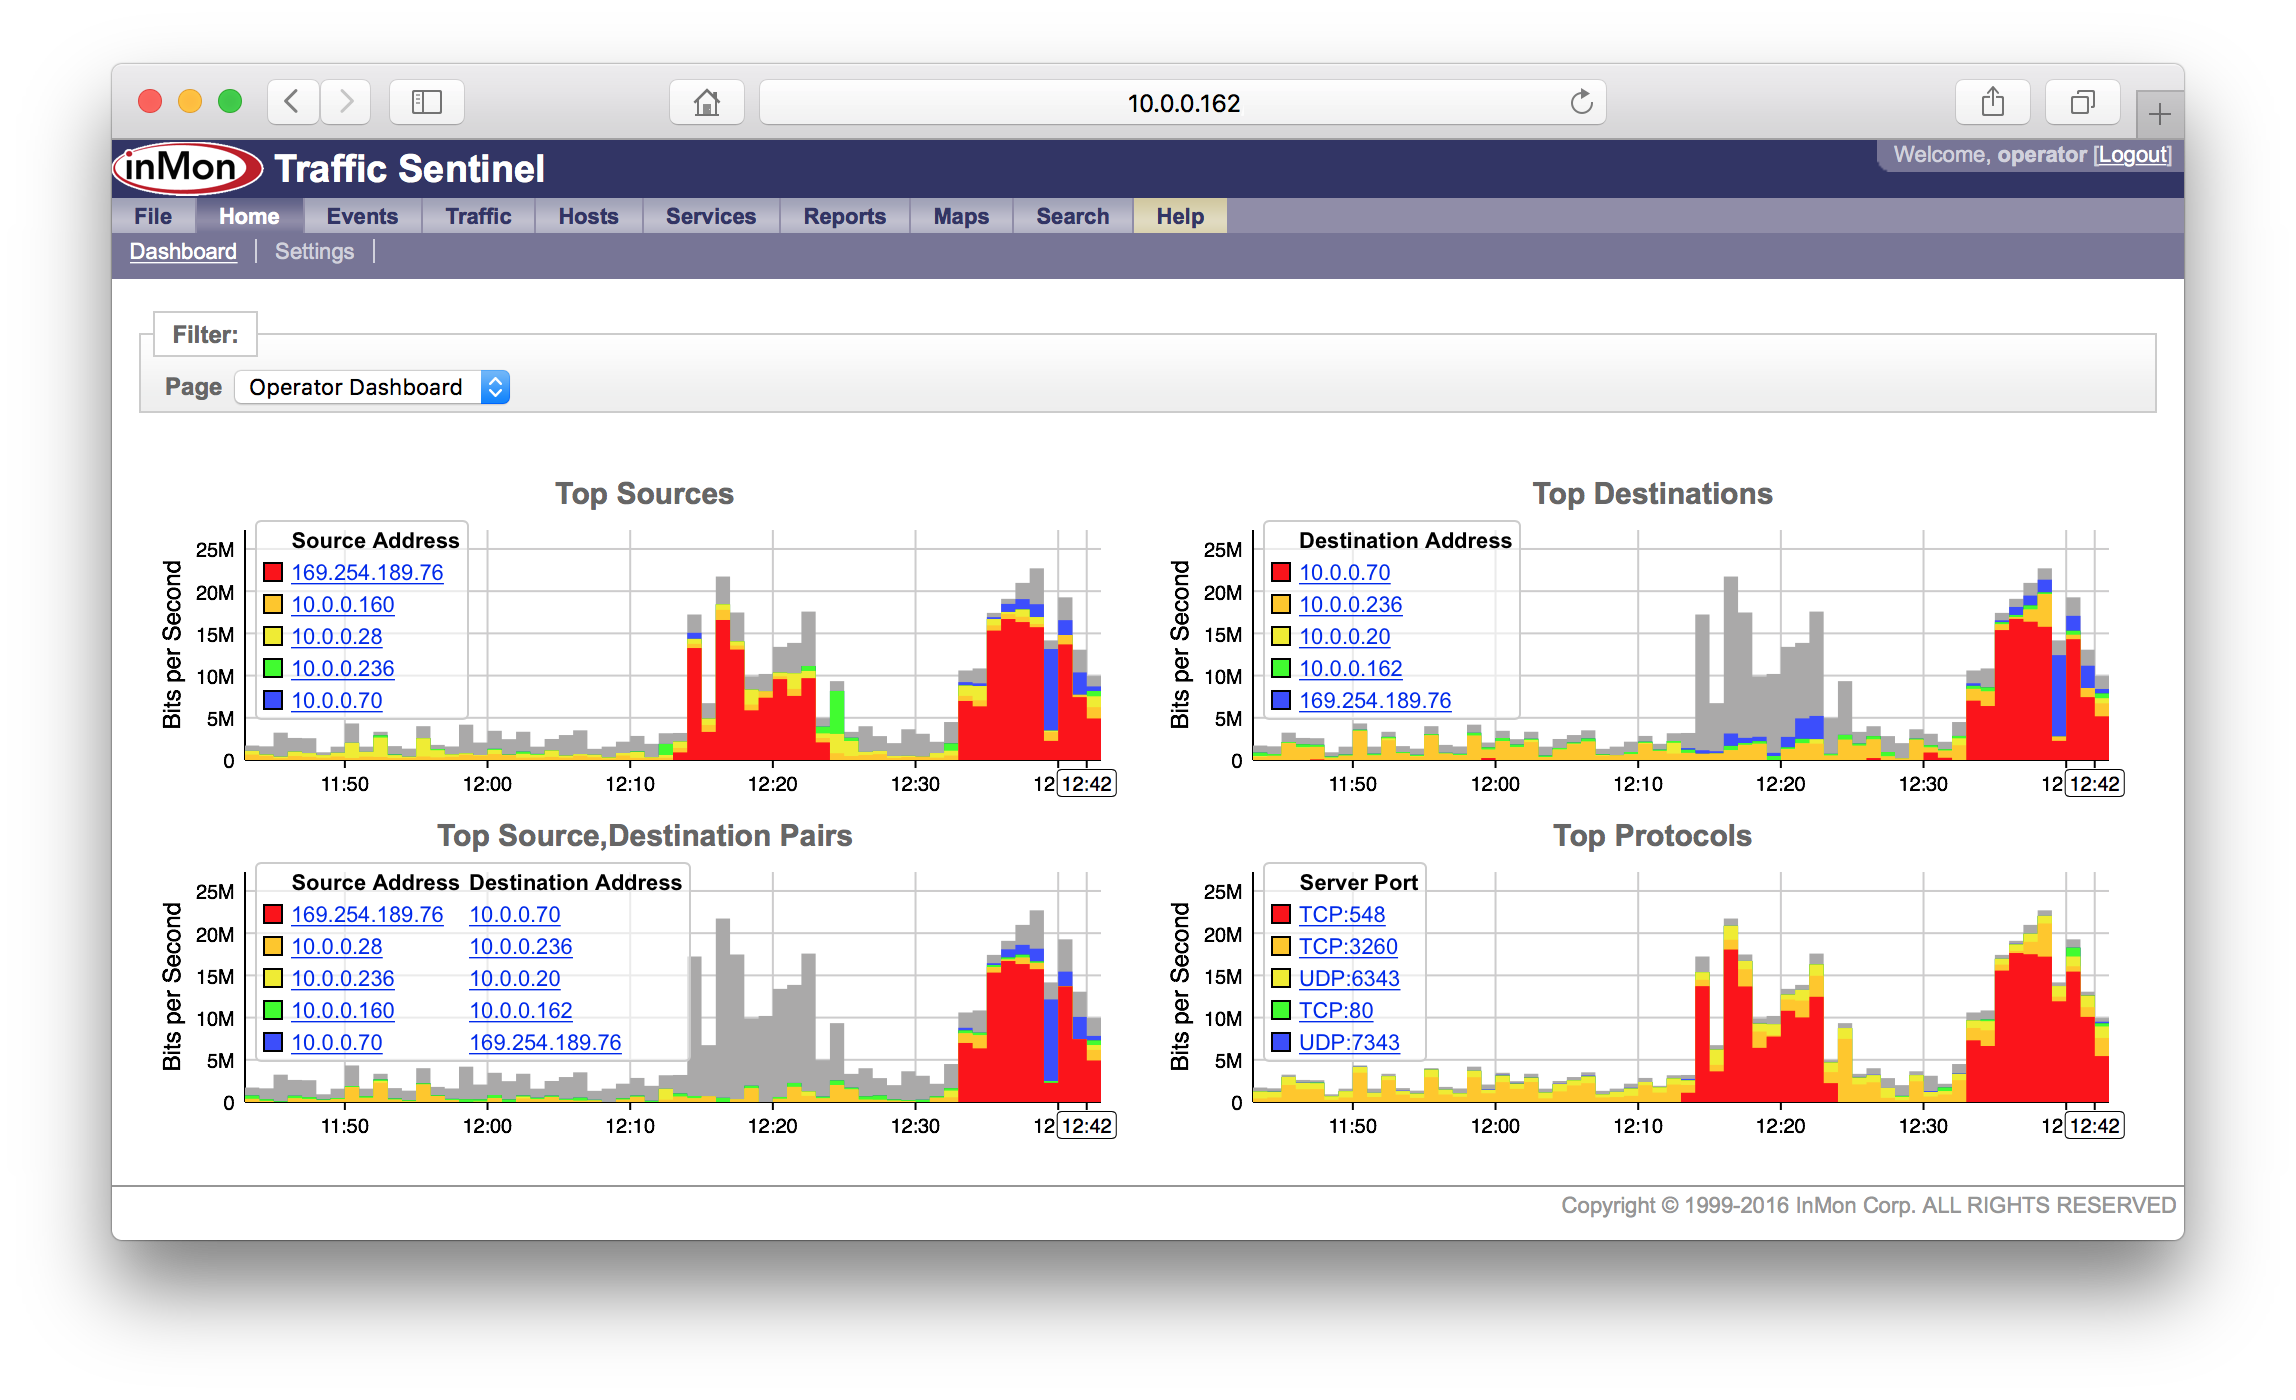
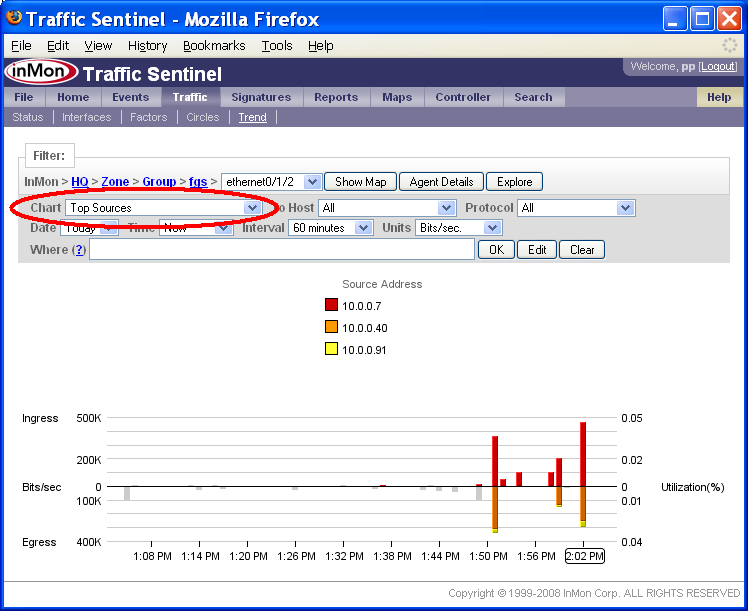
Selecting the Top Sources chart confirms that flow information is being collected for this switch.
5. Define administrative groupings
Dividing the network into administrative groups makes it easier to organize large number of network devices. In addition, grouping devices allows different settings to be applied selectively to groups of devices.
Traffic Sentinel provides a two level hierarchy. At the top level are zones. Each zone can contain groups and each group can contain network agents. The hierarchy provides a single location or path for each agent (i.e. an agent can only appear in one group and a group can only appear in one zone).
In addition to grouping agents, the zone and group hierarchy is also used to organize IP address space. Grouping addresses makes it easier to report on traffic within or between zones and to apply different policies to different groups of hosts (e.g. the traffic patterns and policies associated with servers in the data center are likely to be different from the traffic patterns and policies associated with students in dorms).
There are many ways in which you might choose to group your network; you should choose a scheme that works best for your organization.
5.1 Examples
The following examples give some typical organizational schemes.
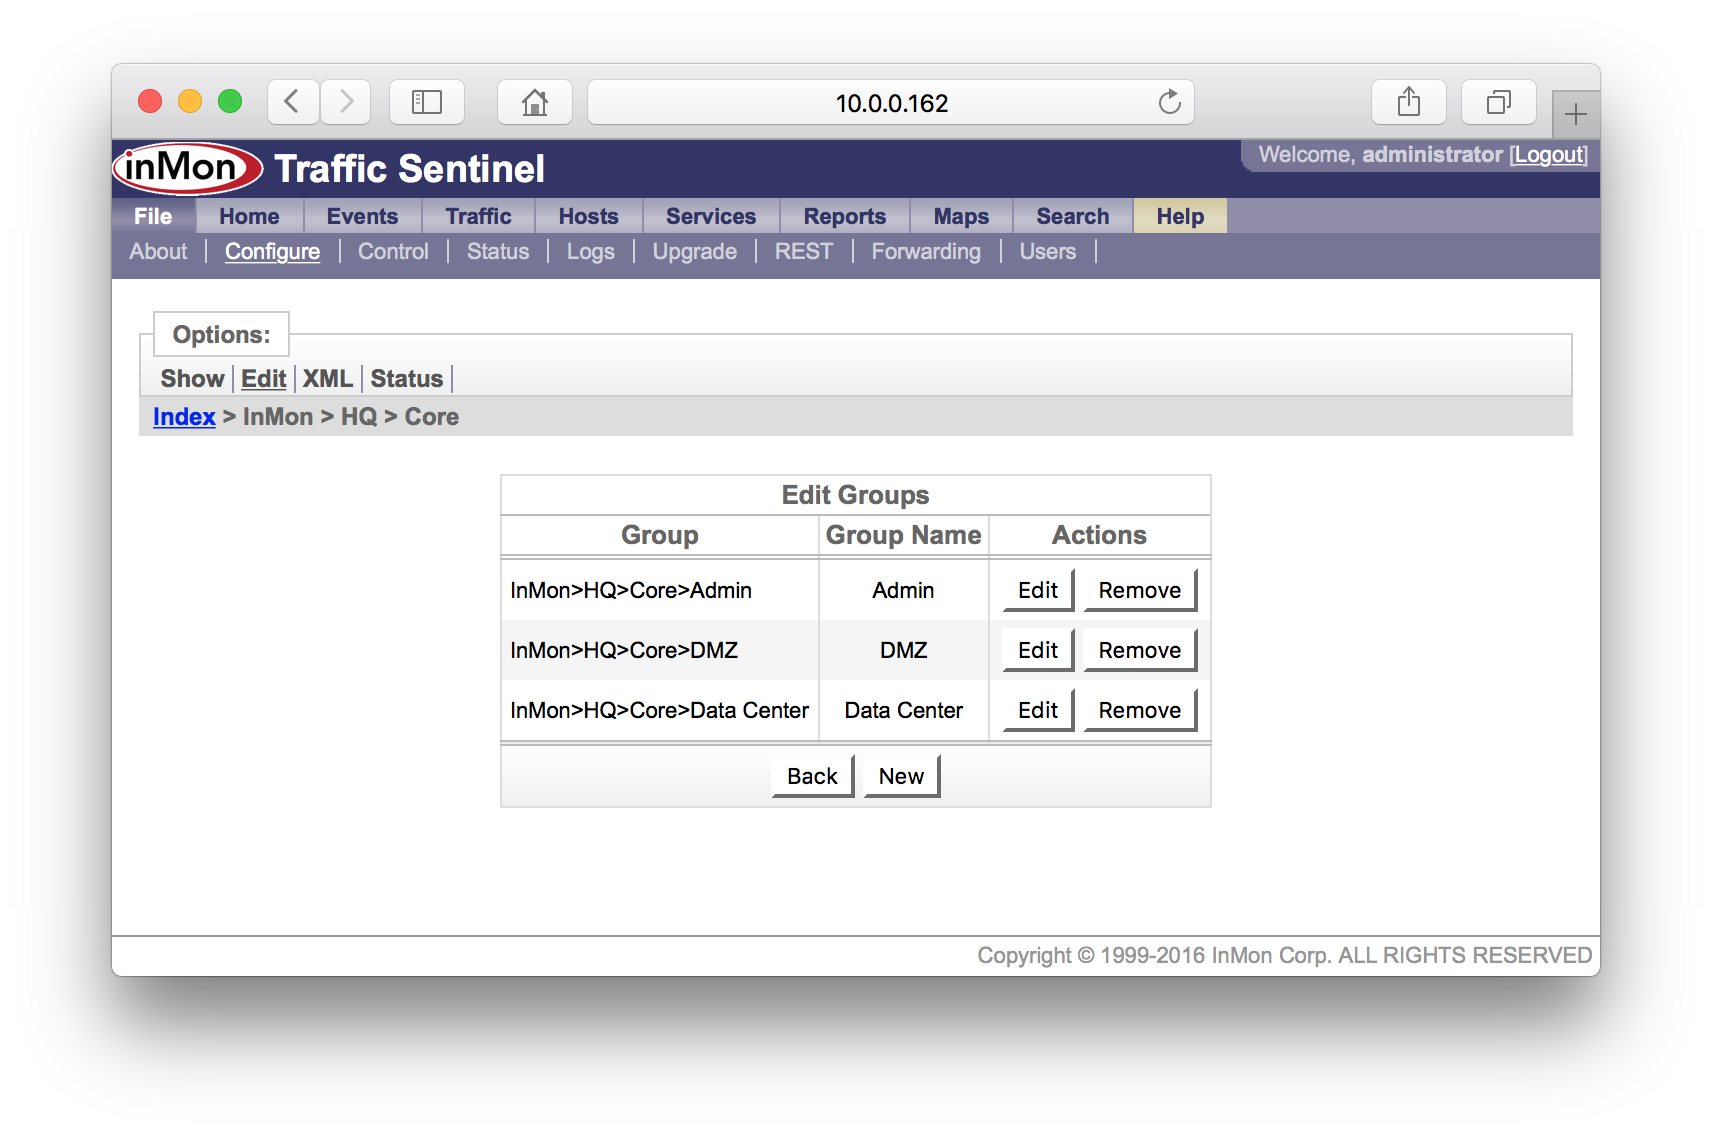
5.1.1 University
A university might choose to organize its network by logical group and then by building. For example:
| Zone | Group |
|---|---|
| Core | Admin |
| Data Center | |
| DMZ | |
| Departments | Biology |
| Business | |
| Chemistry | |
| Engineering | |
| Library | |
| Medicine | |
| Physics | |
| Accommodation | Oceanside |
| Beach |
5.1.2 Company
A company may choose to organize the campus network by building and floor. For example:
| Zone | Group |
|---|---|
| Building A | 1st Floor |
| 2nd Floor | |
| Building B | 1st Floor |
| 2nd Floor | |
| 3rd Floor |