
The traffic visibility from the switches provides context for the cluster performance metrics, identifying the clients making use of cluster services and the back end resources that the cluster depends on. The chart below shows total network activity for the cluster using sFlow data from all the switches. The chart provides a combined view of cluster network activity, integrating data from all switch ports (6,000) to generate a chart that represents the total cluster network activity.
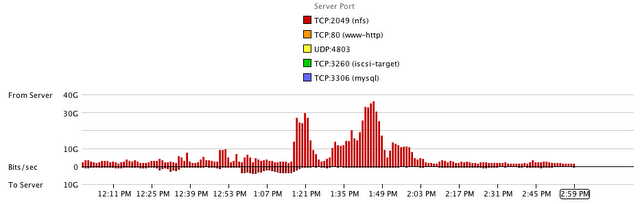
In this case, it is easy to see that the cluster is making heavy use of NFS storage (provided by an NFS scale-out storage array) and that the overall network traffic is dominated by storage traffic. The cluster-wide network and server performance charts make it easy to see correlation between metrics. In this case it is apparent that the NFS traffic is strongly correlated with system swapping activity in the cluster.
This example is typical of a converged network where demand for bandwidth is dominated by storage activity. The next example examines the management of storage traffic.