Strategies for deploying Traffic Server and sFlow Probes
1. Introduction
sFlow is a network traffic monitoring technology has been designed to be embedded within a switch or router. It provides the ability to continuously monitor application level traffic flows at wire speed on all ports simultaneously. Since, initially not all switches and routers will be sFlow enabled, an sFlow Probe can be used to monitor these existing switches.
This application note outlines deployment strategies for network instrumentation to collect traffic data with InMon sFlow Probes and analysis of that data with InMon Traffic Server. It addresses issues of network coverage, as well as impact on network utilization.
2. sFlow Probe Overview
For network devices that do not support embedded sFlow, but do have port mirroring capability, an sFlow Probe can be used to monitor network traffic. An sFlow probe has two network connections to the switch it is monitoring:
- 1Gbps connection to the port that will be used to monitor mirrored traffic.
- 100Mbps connection that will be used for sending flow samples and for interrogating the switch using SNMP and telnet.
Port mirroring is used to send traffic to the sFlow Probe. Care should be taken when setting up port mirroring to ensure that no packet flow is mirrored more than once. Counting some packets twice and others once will systematically bias the results. A worst-case example would be to apply output mirroring to multiple ports. This would have the effect of selectively amplifying the broadcast and multicast traffic by the number of ports. There are two valid port mirroring configurations that ensure no flow is mirrored more than once:
- Mirror inbound and outbound traffic on a single interface.
- Mirror inbound traffic on multiple interfaces.
It is also important to ensure that the mirrored traffic does not exceed the capacity of the mirror port. If traffic is lost on the monitor port then flow volumes will be underestimated.
The sFlow Probe obtains additional information from the switch via SNMP. If the switch performs BGP 4 routing then the sFlow Probe also obtains BGP AS path information directly from the switch
3. Monitoring Traffic on a Single Site
Monitoring and managing network traffic on a single site involves understanding:
- local network traffic any traffic seen on the local network
- traffic leaving and entering the site
3.1 Monitoring Local Network Traffic
If sFlow (or HP Extended RMON) embedded monitoring technology is available in all local devices, Traffic Server can deliver a complete view of local traffic. These devices will be automatically discovered and traffic monitoring enabled.
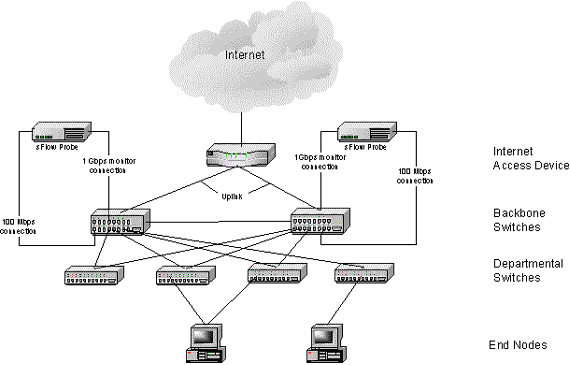
However, if no embedded monitoring is available, a good strategy is to start with adding network traffic monitoring instrumentation for the backbone switch and then progressively adding monitoring technology to monitor departmental and workgroup switches for full coverage. This can be achieved by using an sFlow Probe attached to the monitor/SPAN of the switches.
The following examples give two methods to instrument the backbone with an sFlow Probe:
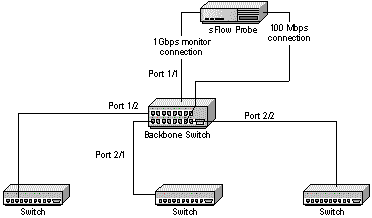
- Monitoring all input traffic on all ports of the backbone switch
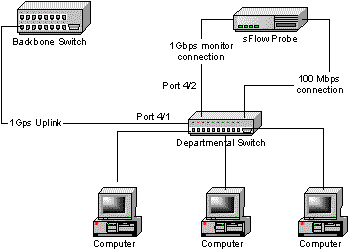
- Monitoring both directions of traffic on the uplink connecting a departmental switch to the backbone switch.
Figure 1 shows a backbone switch. By monitoring input traffic on all the switch ports, all traffic on the switch is seen.
The following commands configure port mirroring for a backbone switch where the probe is connected to port 1/1 and where ports 1/2, 2/1 and 2/2 are to be monitored (these commands are for a Foundry BigIron switch - consult your switch documentation for the appropriate commands).
BigIron(config)# mirror-port e 1/1
BigIron(config)# interface e 1/2
BigIron(config)# interface e 2/1
BigIron(config)# interface e 2/2
BigIron(config)# monitor in
Figure 2 shows a departmental switch connected via a high-speed uplink to a backbone switch. The departmental switch is configured to mirror traffic in both directions on the uplink. Repeating this configuration for all departmental switches connected to the backbone switch will give complete visibility into backbone traffic.
The following commands configure port mirroring on a departmental switch where the probe is connected to port 4/1 and that the uplink is on port 4/2 (these commands are for a Foundry BigIron switch - consult your switch documentation for the appropriate commands).
BigIron(config)# mirror-port e 4/2
BigIron(config)# interface e 4/1
BigIron(config)# monitor both
3.2 Monitoring Traffic Leaving or Entering a Site
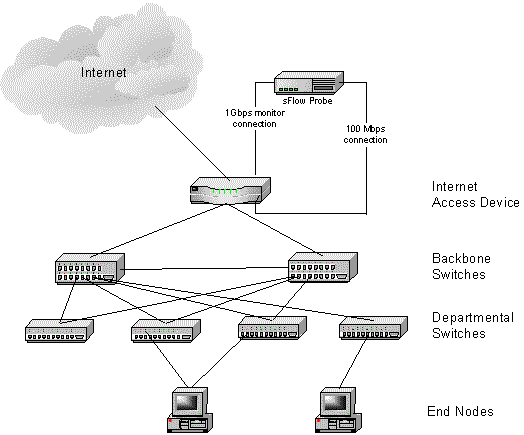
Monitoring traffic entering or leaving a site can be achieved by enabling sFlow on the access router or switch. If embedded sFlow is not available an sFlow Probe can be used. In this case, the Internet access device should be configured to mirror all input interfaces to the monitor port. Figure 3 illustrates this configuration.
It is possible to monitor traffic entering and leaving a site by using an sFlow Probe to monitor traffic in both directions on the backbone switch uplink. In this case, the backbone switch is configured to mirror both directions of traffic on the uplink to the monitor port. Figure 4 illustrates this configuration.
 Figure 4 Using an sFlow Probe to monitor a Backbone Switches for traffic
entering and leaving the site
Figure 4 Using an sFlow Probe to monitor a Backbone Switches for traffic
entering and leaving the site4. Monitoring Traffic on WAN Links
In this scenario, it is assumed that the focus for traffic management is the traffic across links between sites and not on the traffic patterns on the remote sites themselves. There are two methods to accomplish this:
- Enable monitoring on all input interfaces of the local router (including LAN ports). This allows traffic destined for a remote site to be extracted from all input traffic
- Enable input monitoring on the WAN interfaces of the routers associated with the WAN links to be monitored.
If it is not possible to enable traffic monitoring on the routers, it is possible to monitor traffic that transits the WAN by monitoring traffic in both directions on the uplinks of the backbone switches, as in Figure 4.
5. Monitoring Traffic on Multiple Sites
The recommended configuration is to deploy a Traffic Server at each remote site. Each Traffic Server will be configured to collect traffic data from the local network. The Traffic Servers can be configured to be aware of each other, and automatically track delay and loss statistics between each pair of sites. Using multiple Traffic Servers, also gives a more detailed picture of inter-site traffic patterns, for example identifying top talkers between sites.
One Traffic Server can be used to collect data from monitoring points on remote site networks. However, traffic data will be sent across WAN links:
- A typical switched network with default sampling rate settings will generate 200Kbps of sampled traffic data for every 1000 switch ports. Additional traffic for auto-discovery will also be generated. In the worst case, a broadcast or multicast storm on the remote network may saturate the WAN link. This is because broadcast and multicast traffic is seen by many switch ports, so a burst of this traffic will cause many samples to be generated.
- Loss of WAN connectivity to a remote site will result in loss of visibility to traffic on the remote site and consequently a gap in the historical data.
These problems can be avoided by deploying a Traffic Server at each remote location.
6. Filling in the "Blind-Spots" with NetFlow
In some situations, where a network device does not support port mirroring, or where port mirroring is inappropriate, enabling NetFlow can remove a blind-spot. Traffic Server will accept NetFlow v5 and v7. When using NetFlow, consider the following:
- NetFlow export results in bursty high traffic volume. NetFlow data is exported over UDP, but it is sensitive to packet loss. Exporting NetFlow across a WAN link can have a severe impact on the WAN link utilization, and may result in packet loss. Exporting NetFlow to a local Traffic Server minimizes this impact.
- The generation of NetFlow data may place a heavy processing and memory usage burden on the device. It may not be desirable to enable NetFlow on all interfaces of the device.


