
Drill-down to identify sources of congestion
Traffic Server provides a number of tools for real-time network monitoring and trouble shooting. These tools are accessed through the Monitor menu on the left of the main Traffic Server window. The Monitor functions are most effective when used in conjunction with thresholds. Thresholds are used by the Monitor application to assess to significance of traffic and to guide you to the areas in the network that are experiencing the greatest traffic problems.
There are three ways that you are likely to enter the Monitor tools:
- An email, trap or syslog notification will contain a URL linking you into a detailed view of the top contributors to a threshold violation.
- Clicking on Monitor > Events will let you browse the event log. Clicking on a threshold event takes you to a detailed view of the top contributors to the threshold violation.
- Clicking on Monitor > Traffic provides a high level view of the areas of the network that are experiencing difficulty. You can drill-down to subnets, agents and ports to locate network problems.
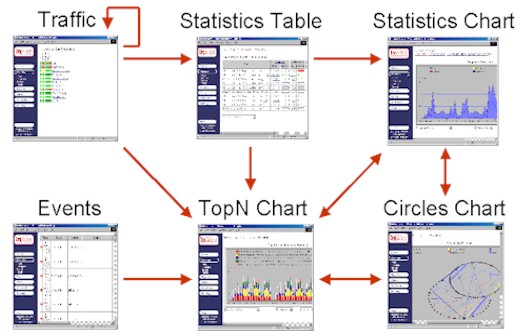 Figure 1 Drill-down relationship between Monitor tools
Figure 1 shows the different Monitor tools and the navigation paths between them. In general you can drill-down by clicking on an item of interest. Consult the on-line help for detailed descriptions of each tool (Note: you can click on any of the tools Figure 1 to access on-line help on that tool).
The following example illustrates how a congestion problem can be analyzed by drilling-down among the Monitor tools.
Is there a problem?
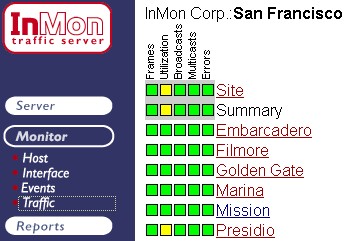 Figure 2 Monitor > Traffic view
Figure 2 shows a typical Monitor > Traffic view. The yellow status boxes ![]() indicate that there is high utilization in the Presidio zone of the network. Clicking on yellow box on the Presidio row drills-down to a Statisics Table showing the most utilized interfaces in the Presidio zone.
indicate that there is high utilization in the Presidio zone of the network. Clicking on yellow box on the Presidio row drills-down to a Statisics Table showing the most utilized interfaces in the Presidio zone.
Where is the problem?
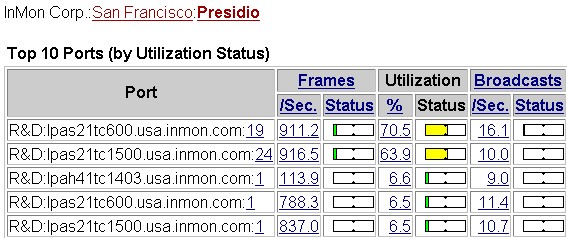 Figure 3 Statistics Table
The Statistics Table in Figure 3 shows all the top interfaces in the Presidio zone sorted by Utilization. It is easy to see two ports have a marginal status. Clicking on the top status bar ![]() drills-down to a Top N view showing the top sources of traffic on port 19 of switch lpas21tc600.
drills-down to a Top N view showing the top sources of traffic on port 19 of switch lpas21tc600.
Who is causing the problem?
 Figure 4 Top Sources
Figure 4 shows the top sources of traffic on port 19 of switch lpas21tc600. It can clearly be seen that the increase in traffic started 4 minutes ago and that host rfgesp69 is responsible for the increase. A more detailed view of the traffic flows can be obtained by changing the selected view from Top Sources to Top Connections.
What are they doing?
 Figure 5 Top Connections
Figure 5 shows a top connections view. It is now clear that the increase in traffic is due to a remote shell connection between rfgesp69 and rfgesp77. Clicking on the legend item for this flow ![]() drills-down to a more detailed description of the traffic flow.
drills-down to a more detailed description of the traffic flow.
What are the details?
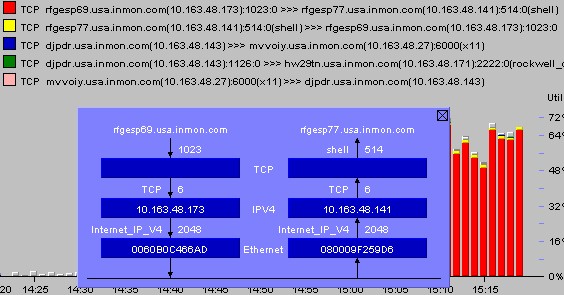 Figure 6 Connection Details
Figure 6 shows the full flow details, including the TCP ports, IP addresses, host names and MAC addresses. Further analysis can be performed by clicking on addresses in the detail view. This will provide access to detailed information on the selected host and provide access to historical traffic reports that profile the host's past behavior.
| Related Topics |
|