
Creating Report Templates
The interactive report editor Report>Edit is used to construct and modify reports. Selecting and parameterizing existing report sections to construct new reports is usually the simplest way to generate custom reports (see the Querying and Reporting tutorial).
Traffic Sentinel's reporting capabilities make use of template documents written in XML (eXtensible Markup Language). The XML document specifies the structure of the report (the title, heading, sections and text). Scripts contained in the report template are used to construct queries, process results and add tables and charts to the report.
This tutorial describes how to build and install report templates that add new functionality to Traffic Sentinel. Before proceeding with this tututorial it is worth studying the Scripting Queries tutorial since the it introduces the scripting capabilities of Traffic Sentinel.
XML
The following example illustrates the basic elements of a template. First, create a new template file, example.xml with the following contents:
<template name="Tutorial" category="miscellaneous">
  <description>This report contains tutorial examples.</description>
  <section name="Echo">
    <description>Print the value of the input.</description>
    <usage>Enter a string and see it in a report section.</usage>
    <input name="echostr" type="string" label="String" />
    <script>
var r = Report.current();
r.paragraph(echostr);
    </script>
  </section>
</template>
This simple example demonstrates the basic components of a template. Each template is assigned a category and given a name. The template also has a description. This template contains one section. The section has a name and description. The section also contains a script that makes use of a single input.
Use the Reports>Install page to install the new template file (see Help>Report>Install). Once you have installed this file it should appear on the Report>Query page (under the Miscellaneous category as the Echo query).
Select the Echo query and the following form should be displayed:
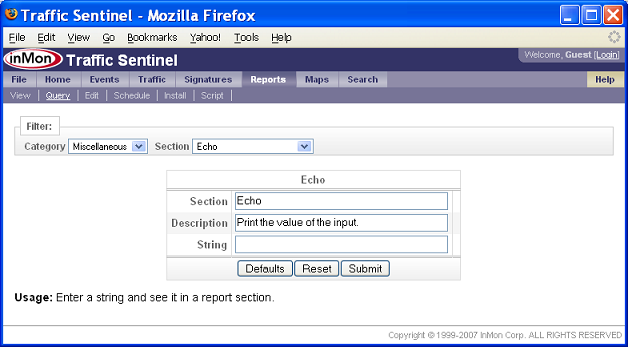
Enter any string in the String field and click on the Submit button to execute the template.
Scripting
The Scripting Queries tutorial described some of the basic scripting techniques in Traffic Sentinel. Generally the best approach to devoloping a new script is to experiment with the script using the Report>Script interface. Once the basic query is working, it can be incorporated into a report template.
When adding a script to a report template certain characters that are part of the XML syntax must be replaced by XML tokens so that the template can be parsed
- ">" should be written as ">"
- "<" should be written as "<"
- "&" should be written as "&"
for(var i = 0; i < 10; i++);would need to be rewritten as
for(var i = 0; i < 10; i++);to be included in a report template.
A useful alternative, especially when writing complex scripts where many characters may need to be escaped, is to escape the whole script using an XML CDATA section. For example:
<script><![CDATA[
// insert script here, no escaping necessary
]]></script>
Note The Neighbor Table example below uses this technique.
Traffic Sentinel provides additional Javascript functions for use in report templates. Try each of the following examples by adding them as sections to your example.xml file.
Report
The Report class provides functions to add information to a report.
<section name="Heading and Paragaraph" >
  <description>Script demonstrating text output from script.</description>
  <script>
var r = Report.current();
var date = r.getTime();
r.heading("Report Time");
r.paragraph("This report ran at " + date);
  </script>
</section>
This example uses the getTime() method to get scheduled time
for the report. The heading() and paragraph() functions
are used to add text and headings to the report. In addition,
tables and charts can be added to reports (see Table and
Chart below for examples).
Table
The tutorial Scripting Queries shows how tables are returned by queries. The following script shows how a query result can be added to a report.
<section name="Top Byte Sources" >
  <description>Top sources of bytes.</description>
  <input name="category" type="view.historytrmx.key" value="ipsource" />
  <input name="interval" type="interval.history" value="today" />
  <script>
var r = Report.current();
var q = Query.topN("historytrmx",category + ",bytes",null,interval,"bytes",5);
var t = q.run();
r.table(t);
  </script>
</section>
Note This script makes use of two inputs, category and
interval with default values "ipsource" and "today" respectively.
The Table class is also useful for adding other types of tabular data to reports.
Suppose that the administratively assigned names of switch interfaces are supposed to indicate how switches are interconnected. The following example involves creating a table that compares the interface name with topology information, highlighting any mislabeled interfaces.
<section name="Neighbor Table" >
  <description>Compare interface names with discovered topology.</description>
  <script><![CDATA[
var r = Report.current();
var n = Network.current();
var interfaces = n.interfaces();
var neighbors = n.neighborMap(interfaces);
var t = Table.create(
          ["sysName","ifName","neighbor sysName","neighbor ifName"],
          ["string" ,"string","string","string"]);
for(var i = 0; i < interfaces.length; i++) {
   if(neighbors[i]) {
     var row = new Array();
     n.path = interfaces[i];
     row[0] = n.sysName();
     row[1] = n.ifName();
     n.path = neighbors[i];
     row[2] = n.sysName();
     row[3] = n.ifName();
     t.addRow(row);
   }
}
r.table(t);
  ]]></script>
</section>
Note The script tests to see if there is a neighbor entry and then uses the Network object to lookup sysName and ifName for the interface and the neighbor; constructing a row which is added to the table. A more sophisticated version of this script could use a regular expression to extract information from the interface names based on the naming convention and automatically flag discrepencies.
Chart
The Chart class is used to construct charts for inclusion in reports.
The following example shows how a chart can be constructed from the tabular result of a query.
<section name="Top IP Sources" >
  <description>Chart showing top IP sources by number of bytes.</description>
  <input name="includetable" label="Table" type="string" value="no">
    <option value="yes">Include</option>
    <option value="no" >Exclude</option>
  </input>
  <script>
var r = Report.current();
var q = Query.topN("historytrmx","ipsource,bytes",null,"today","bytes",5);
var t = q.run();
var chart = Chart.singleSeries(
              "bar", "Top IP Sources",
              t, "IP Source", 0, "Bytes", 1);
r.chart(chart);
if(includetable == "yes") r.table(t);
  </script>
</section>
This next example demonstrates the construction of a trend chart.
<section name="Total Traffic Trend" >
  <description>Chart showing total traffic over time.</description>
  <input name="interval" type="interval.history" value="today" />
  <input name="group" type="group" value="hour" />
  <script>
var r = Report.current();
var q = Query.trend("historytrmx","time,bytes",null,interval,group);
var t = q.run();
var chart = Chart.singleSeries(
              "trend", "Traffic Trend",
              t, null, 0, null, 1);
chart.stack = true;
r.chart(chart);
  </script>
</section>
Inputs
The <input /> tags are an important part of the report template. Inputs allow a script to be used for interactive queries and tailored for use in scheduled reports.
An input can have the following attributes:
- name the name of the variable that will be created in javascript.
- type the type of the variable (see below).
- label a user friendly name that will be used in forms to label the input field.
- value a default value for the variable.
- required by default all inputs must be provided before the script will be run. Setting required to "false" makes the input optional.
Every input must have at least a name and a type.
If an input represents an enumerated type (i.e. it can only have one of a fixed set of values) then <option> values can be used (see the first chart example).
If an input is optional (i.e. required = "false") then the script must not assume that the variable exists. The following fragment shows how the existance of an optional input can be tested
<input name="height" type="integer" />
<script>
var h = 100;
if(typeof(height) != 'undefined') h = height;
Input types are used to check values and ensure that they are valid. When input values are entered into a form they will be checked and the user will be notified if an input has in invalid value. In addition the type of the input is used to provide assistance to the user by providing common options to enter into the input field.
The following types are defined:
- string any string is allowed.
- integer a positive integer or zero is allowed.
- address any address is allowed. Addresses can be further constrained by appending an address type (e.g. address.ip only allows ip addresses).
- subnet a subnet (specified in CIDR notation) is allowed.
- protocol any protocol (e.g. TCP:80) is allowed. If you want to limit inputs to a particular protocol type then appending the type will further constrain the input (e.g. protocol.TCP will only allow TCP protocols).
- agent allows an agent address.
- interface allows a switch/router port.
- path allows site>zone>group>agent style path to specify a part of the network.
- view a view input is used to obtain attribute names from a database view. A view input must always be qualified by a view name (e.g. view.historytrmx or view.rttraffic). Optionally, a view input can be further qualified as a key or a value (e.g. view.historytrmx.key).
- filter a filter input is used to obtain a boolean filter expression that can be applied in a query. The filter input must always be qualified with a view name (e.g. filter.historytrmx).
- interval a time token that can be used to specify an interval in a query (e.g. "today").
- group a time grouping used in a trend query (e.g. "hour").
If a type ends in the token [] then a comma separated list of values of the specified type is allowed (e.g. view.rttraffic.key[]).
Developing a Report Script
The Report>Script tool is a useful way to develop new scripts for reports. If you create a Report object in a script and add headings, paragraphs, tables or charts to it, then you will be able to preview the results.
Try cutting and pasting the following simple script into the Report>Script form:
var r = Report.current();
var q = Query.topN("historytrmx","ipsource,bytes",null,"today","bytes",5);
var t = q.run();
var chart = Chart.singleSeries(
              "bar", "Top IP Sources",
              t, "IP Source", 0, "Bytes", 1);
r.chart(chart);
println("done");
If you run the script, you should see "done" printed as the result. In addition the buttons, PDF and HTML will let you see the report output. The XML button will generate an XML report template containing the script (escaping special characters as needed). Simply cut and paste the section containing the script into a report and add inputs to complete the development of the new query.
Using print() and println() statements in the script can be useful for debugging and has no effect on the resulting report.
| Related Topics |
|