
Configuring Traffic Sentinel
The Traffic Sentinel configuration allows you to tell the server what to monitor, and how:
- How to divide up the network into a hierarchy of Zones and Groups to reflect your internal administrative domains.
- Where to find the switch and router agents, and talk to them with SNMP.
- What are the end-host subnets that make up the local IP address space on your network.
- What thresholds to apply, so that events are raised on excessive load conditions, or high error rates.
- What sampling rates to use for different link speeds (where sampling is configured automatically via SNMP).
The configuration is represented as an XML document on the server. You can choose to view and edit the XML directly, or you can use the graphical editor provided:
Configuration Hierarchy
The configuration is represented as a hierarchical tree-structure:
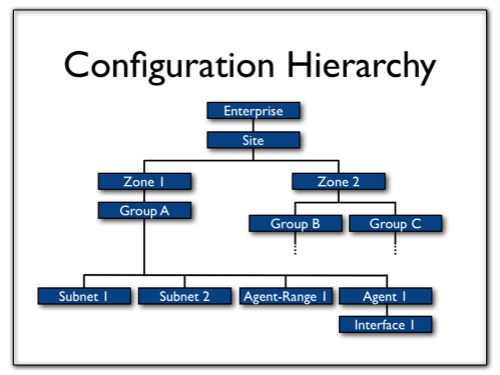
The enterprise and site levels are fixed, because one server is always responsible for just one site (even if this particular "site" spans several locations). The zone and group levels are abstract. There is no limit on how many can be defined, and they can be given any name. A common convention is to use zones to represent distinct locations, with groups being used to describe separate buildings or floors. It is also common to separate out the network core from the edge. A typical setup will divide the network into about ten zones. Within a zone, each groups can be a collection of subnets to descibe the end-host space, agents to identify individual switches or routers and agent-ranges to identify a range of addresses where switches or routers can be found. Specifying an interface is only ever needed if you want to override a setting just for that interface.
Note: the term CIDR (Classless Inter-domain Routing) is used here to mean any IP subnet expressed in the form: address/mask-bits.
This tree structure allows end-hosts and the devices that connect them to be logically grouped together, even if there is no overlap in the address space.
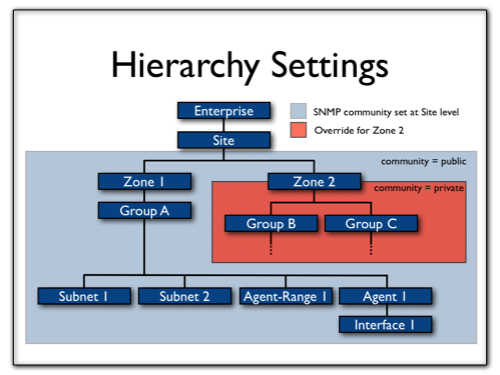
Dividing the network into a hierarchical tree structure like this makes it possible to define default settings for the whole network, and the only override them selectively for a particular subtree. In this example, we illustrate how the SNMP community string can be set for the whole site, but then overridden selectively below.
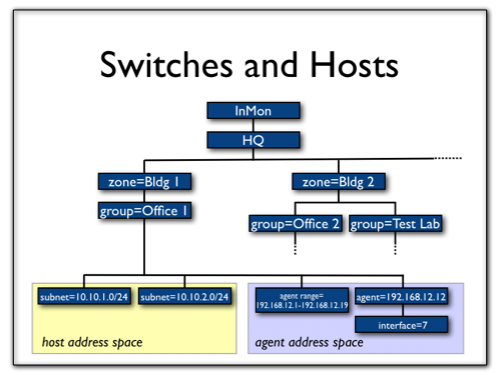
Here is a typical scenario, where the zone and group names have been chosen to represent the internal structure of the organisation, and capture all the address space being used:
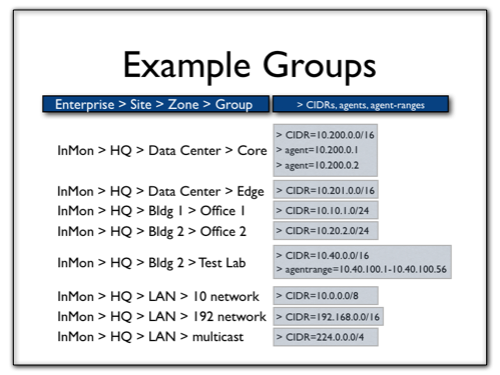
Note: Each address will be matched to a single group based on how specific the CIDR is. In the example above, the address 10.10.1.1 would matches the Bldg 1>Office 1 group as well as the LAN>10 network group. It will be assigned to the Bldg 1>Office 1 group since 10.10.1.0/24 is more specific than 10.0.0.0/8.
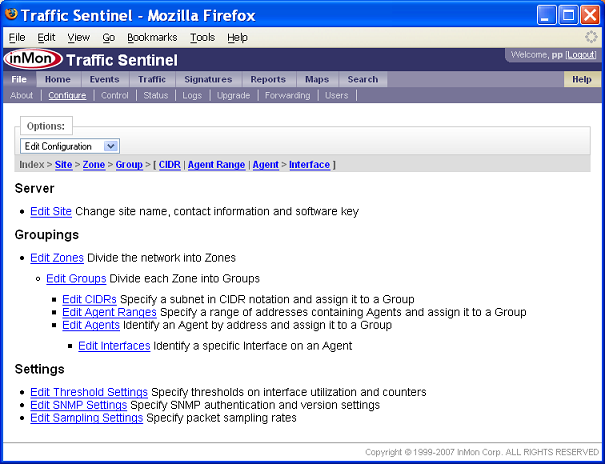
The configuration is represented as an XML document on the server. You can choose to view and edit the XML directly, or you can use the graphical editor provided. In the Options pane you can select:
- Show Configuration to see a formatted representation of the current configuration.
- Edit Configuration to use the graphical editor to make changes.
- XML to download the XML configuration file, and upload it again after making your changes.
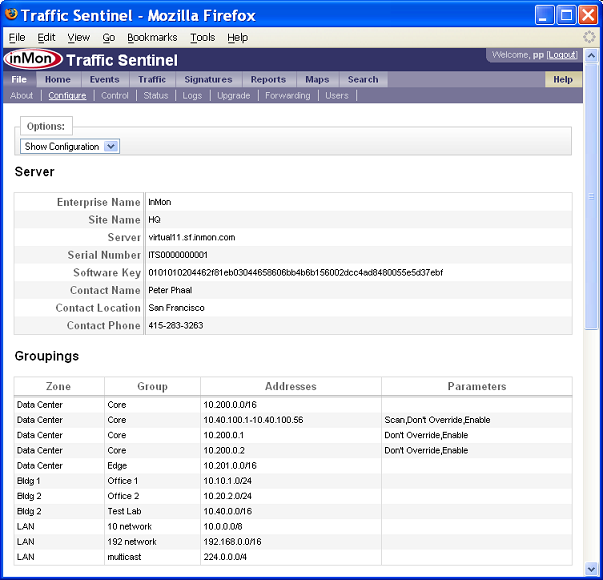
Below is how that configuration looks once it has been entered into the server. First using the Show Configuration option:
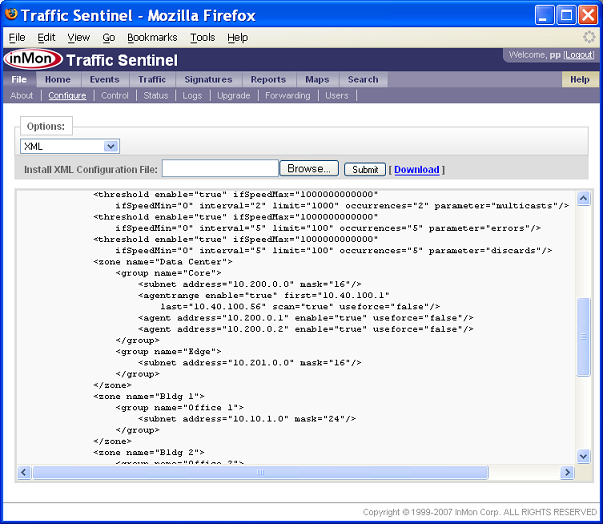
And here is the same configuration, but using the XML option to view the raw XML text. Note how the SNMP settings have been selectively overridden:
Threshold Settings
An interface counter threshold consists of a Limit, a Minutes Over Limit and a Total Minutes value. Every minute Traffic Sentinel will check thresholds against every monitored interface and determine its status based on the threshold settings. The following illustration demonstrates the calculation of interface status:
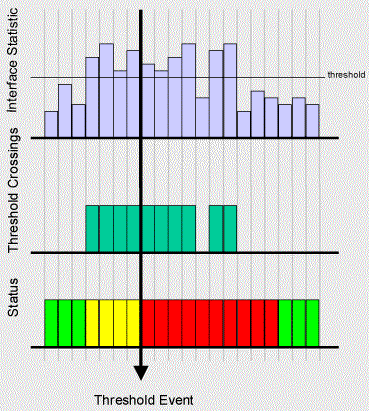
The Interface Statistics chart shows the minute by minute changes
in an interface statistic. The horizontal line shows the threshold Limit
value. The second Threshold Crossings chart shows the intervals when
the Limit has been exceeded. The final Status Chart shows the
status as marginal ![]() as soon as the threshold value starts to be exceeded. The
status changes to critical
as soon as the threshold value starts to be exceeded. The
status changes to critical ![]() and an event is generated after 4 consecutive
intervals (i.e. Minutes Over Threshold is set to 4) in which the Limit value has been
exceeded. Finally, it takes 4 intervals of values below the threshold value
before the status returns to good
and an event is generated after 4 consecutive
intervals (i.e. Minutes Over Threshold is set to 4) in which the Limit value has been
exceeded. Finally, it takes 4 intervals of values below the threshold value
before the status returns to good ![]() (assuming that Total Minutes is also set to 4).
(assuming that Total Minutes is also set to 4).
Total Minutes can be larger than Minutes Over Threshold. In
this case a notification occurs ![]() if the Limit value is exceeded at least
Minute Over Threshold times in Total Minutes consecutive
intervals. For example, suppose Total Minutes is set to 10 and
Minutes Over Threshold is set to 4. A notification will occur if 4
intervals in any 10 interval period exceed the Limit. In addition,
the status will only return to good
if the Limit value is exceeded at least
Minute Over Threshold times in Total Minutes consecutive
intervals. For example, suppose Total Minutes is set to 10 and
Minutes Over Threshold is set to 4. A notification will occur if 4
intervals in any 10 interval period exceed the Limit. In addition,
the status will only return to good ![]() after 10 consecutive periods with the
value under the Limit.
after 10 consecutive periods with the
value under the Limit.
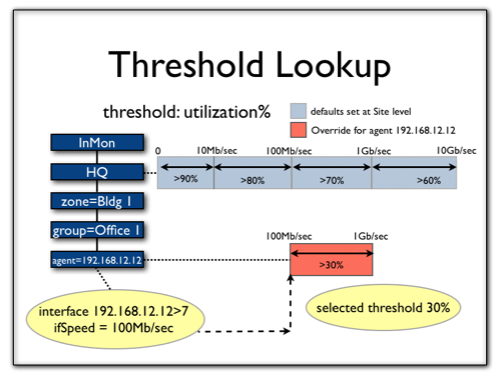
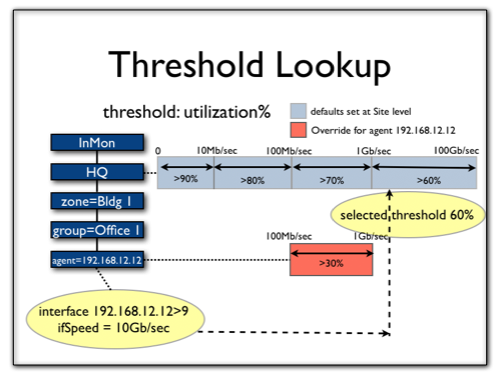
Thresholds can also be configured to apply at any level in the hierarchy. The product ships with default settings defined at the Site level, which can be edited, or overridden below. Here is an example of entering an new threshold setting:
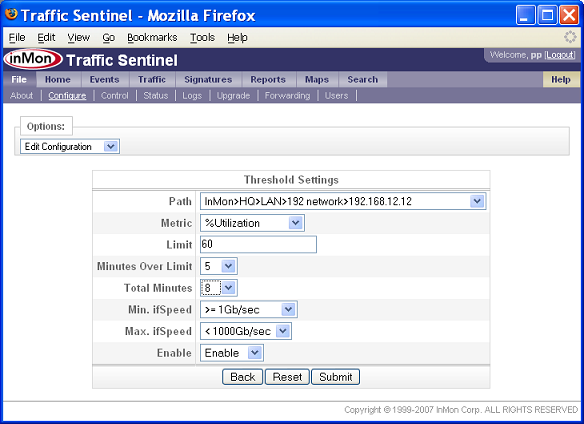
The threshold to be applied to a given interface is looked up in the configuration tree, starting from the Interface (if one is defined) and working up the tree from there. In the example below, the Utilization threshold has been overridden just for one Agent:
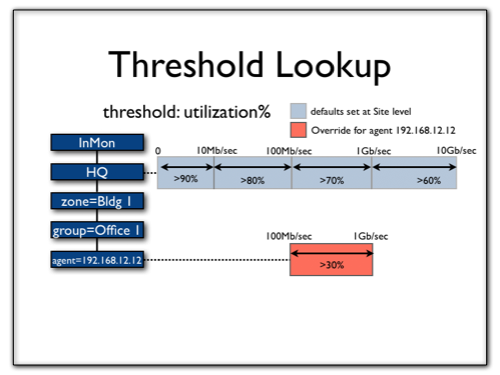
Note that the override was only for a certain range of interface speeds. Hence the threshold to be checked against may vary from interface to interface on that switch:
Note: In general, thresholds should be set so that only severe traffic problems that impact quality of service will generate events. Critical events are intended to provide actionable notification of problems to network operators. When setting thresholds, try to identify a traffic level that will have a noticeable effect on network service levels. Set a duration that corresponds to an unacceptable period of poor service. The goal is to generate very few, significant events indicating severe problems that require immediate attention. Thresholds are not intended as a reporting tool to generate statistical information about network traffic. Traffic Sentinel provides detailed query and reporting capabilities that can be used to trend traffic and identify busy links before severe congestion problems occur (see Querying and Report).
Sampling Settings
In many cases the packet-sampling rate is configured using the command-line interface (CLI) on the device. However some devices support discovery and remote-control using SNMP. For those devices, the sampling rate can be chosen by Traffic Sentinel, and configured automatically. For this to operate correctly, the server must be permitted to make SNMP SET requests to the devices. It will use the SNMP write community if that is configured here. The choice of which sampling-rate to use for a given interface is governed by the Sampling settings, which can be overriden at any level in the tree. The search to determine which sampling rate to use for a given interface is dependent on the ifSpeed, so it is similar to the threshold setting search above. Devices that you want to discovery and configure using SNMP in this way must appear in an individual Agent entry, or be included in an Agent Range entry with scan=true. The File>Control page allows a new scan to be initiated immediately, but the agent ranges will also be scanned every night to look for new devices that may have been added to the network. They will then be discovered and configured automatically.
Monitoring Protocols
The following table indicates, for each monitoring protocol, how Traffic Sentinel will communicate with that device and where it will choose to place the device in the configuration hierarchy. This will then determines the threshold, sampling and SNMP settings that will be used, and determine where that device will be found under Traffic>Status.
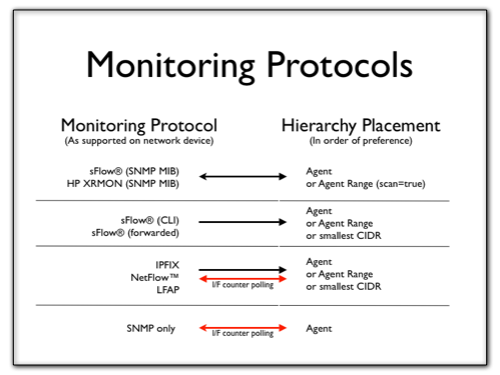
Note that if the monitoring protocol does not include polled interface counters as part of the normal delivery of information, then Traffic Sentinel will automatically attempt to collect that information by polling using SNMP.
Using Zones and Groups
As shown above, capturing the structure of your network using zones and groups is helpful for setting SNMP, Threshold and Sampling parameters. However this information also has a number of other uses throughout the product.
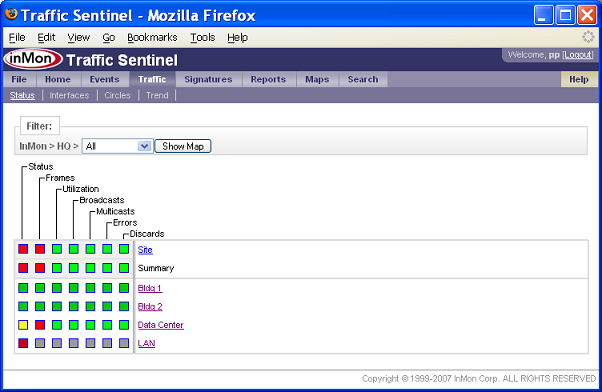
For example, it is used to provide a natural drilldown for navigating through the network and scoping the queries on the Traffic pages. This first view, (taken from a different server) shows how the top-level status is broken out by zone:
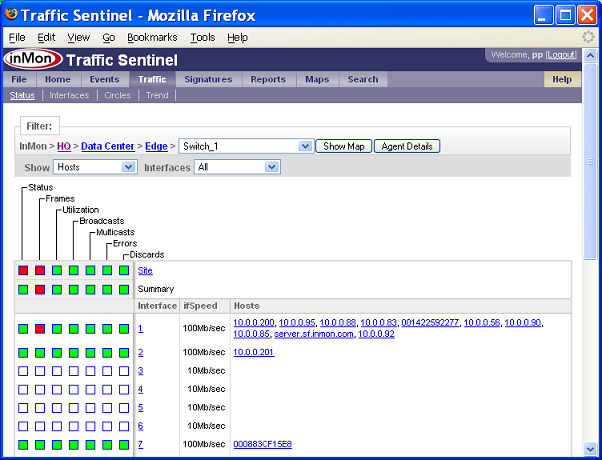
Clicking to drill down can take you all the way to the individual switch ports:
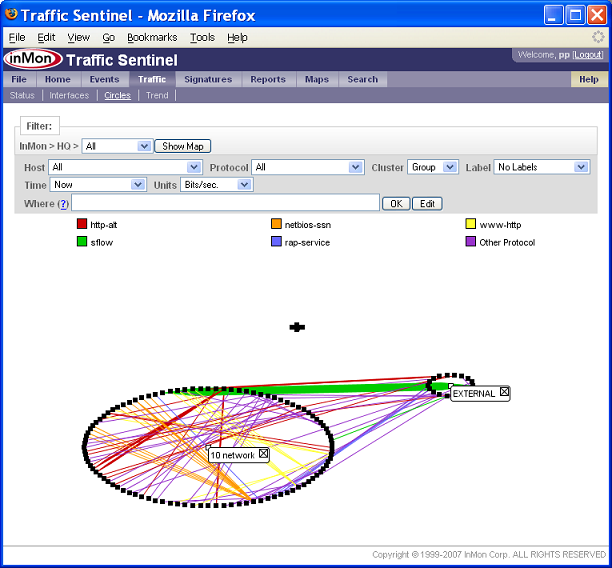
The Traffic>Circles page can also use the zone or group information to cluster end hosts for detailed visualization of the top flows crossing the network. Here the cluster> setting is by zone:
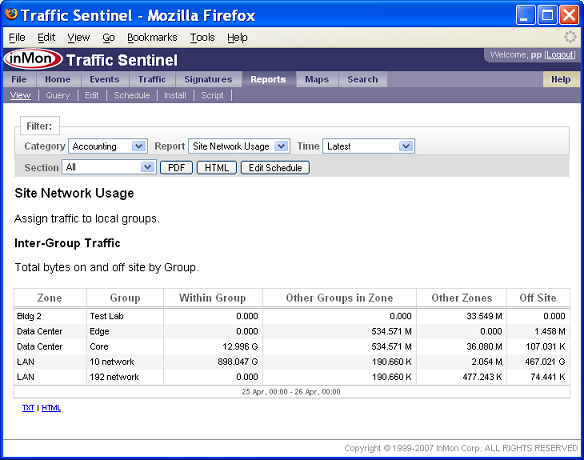
Understanding zone-to-zone or group-to-group traffic patterns can be useful for capacity planning, designing network partitioning and traffic accounting. Here is an example report showing the total internal and external traffic, broken out by zone and group:
The zone and group definitions are automatically used by the security reports and security signature rules in order to know which hosts are on your network and which hosts are not. You can use the zone and group names themselves when defining security rules, and you can always filter on fields that represent the zones and groups in the query engine. For example, see the Where field in the following report section:
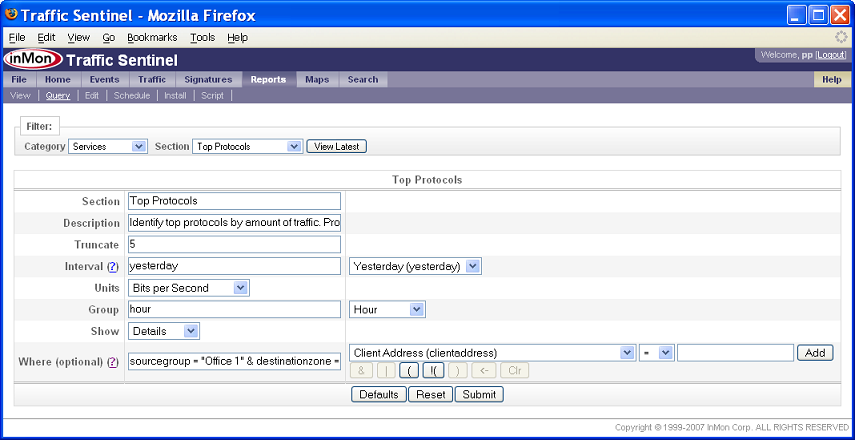
The filter expression:
sourcegroup = "Office 1" & destinationzone = "Data Center"
will select traffic from any host that was located in the "Office 1" group destined to any host that was located in the "Data Center" zone, according to the CIDR settings in the configuration file. Later you might expand the definition of the "Office 1" group to include further subnets, and this report will adapt automatically the next time it is run.
| Related Topics |
|