
Customizing the Dashboard
The Home>Dashboard page can be tailored to pull together information from a variety of sources, creating a "control panel" displaying all the critical information needed to manage the network.
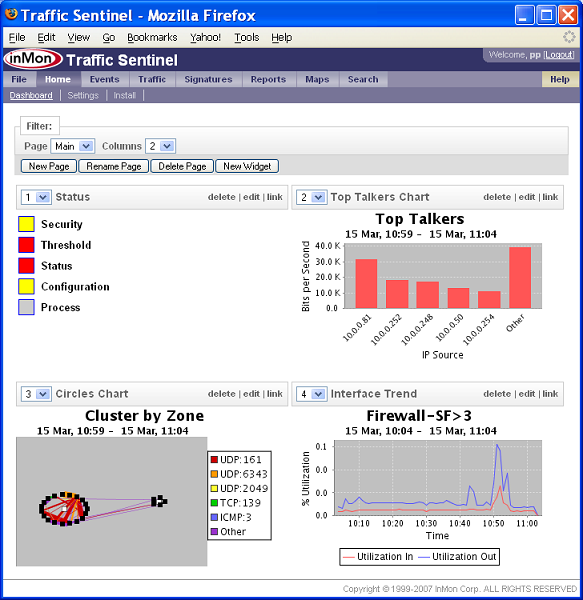
The Dashboard consists of one or more pages of "widgets". Each widget can displays information in the screen area allocated to it, updating automatically as new information is available.
Organizing the Dashboard
The first task in organizing the dashboard is to define the pages that you will use to group widgets. Typically you will have a "Main" page that contains widgets providing an overview of overall network health. Additional pages can be defined that are geared toward different tasks or areas of the network. To make navigation easier, give each page a meaningful name.
When you add a new widget to a page, the widget will appear as the last widget on the page. Enter parameter setting and click on the Save Changes button to see their effect. If there is a problem with any of the settings the corresponding input will be highlighted in red and the changes will not be accepted. Click on the Close button to close the form. Click on the number at the top left of the new widget's bar to set its position on the page.
To modify an existing widget, click on the widget's edit link to show the settings form.
Each widget has a Title setting that can be used to change the text displayed in the bar above the widget. Giving clear titles to widgets will help you remember how the widget was configured and what data it is displaying.
Note: Before you can customize the dashboard, you must have an account (and be logged into your account). You can log in using the Login link at the top right of the window.
Widgets
A number of standard widgets are included with the product. In addition, widgets are distributed as xml files that can be installed using the Home>Install page. Finally, you can create your own widgets from scratch if you have a particular requirement that cannot be satisfied by any of the existing widgets.
Understanding how to use the different types of widget it critical to constructing an effective Dashboard. This section describes the widgets that ship with the product.
Search
The Search widget is used to search for switches, routers or hosts in the network.
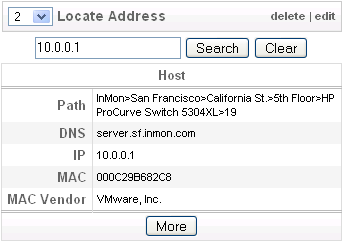
Enter an address in the input box and click on the Search to display location and other information relating to the address. Click on the More button to see addtional information.
Status
The Status widget summarized recent events by type, showing the most severe event within each category over the specified Interval.
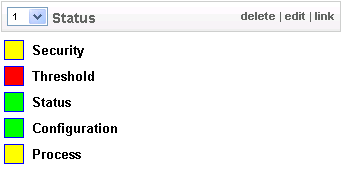
Click on a status box in the table generated by the widget to see the events that contribute to its value.
Remote Status
The Remote Status widget displays status information from a remote Traffic Sentinel.
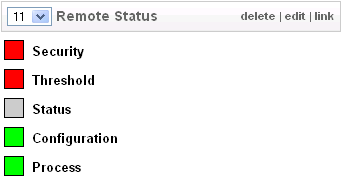
Click on the link at the top of the widget to be directed to the remote server.
The Remote Status widget accepts the following arguments:
- Host The hostname or IP address of the remote Traffic Sentinel.
- User The username to login.
- Password The password to login.
- Interval The time interval over which status is to be shown.
Note The User and Password settings are only required in the Reports>Script page on the remote Traffic Sentinel is password protected.
Interfaces
The Interfaces widget is used to display the status of selected interfaces. A single status box for each interface summarizes the status information available on the Traffic>Status page.
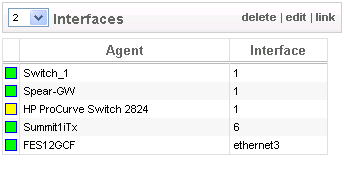
The Interfaces argument consists of a comma separated list of interface identifiers (of the form IP Address>ifIndex). The easiest way to obtain the information for the interfaces you are interested in is to use the Search>Agent/Interface form.
Note Clicking status boxes in the interface table generated by the widget will link you to information on the interface.
Interface Trend
The Interface Trend widget displays the utilization trend for a selected interface. Use this widget to track utilization on critical links.
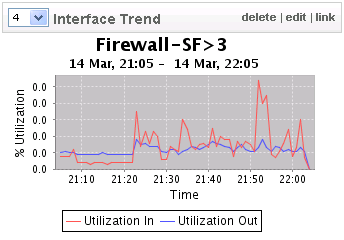
The Interface argument lists interfaces that you have recently visited. If the interface you want isn't in the list, click on the Search button to find the interface.
Top Talkers Chart
The Top Talkers Chart widget displays the most active sources of traffic as a chart.
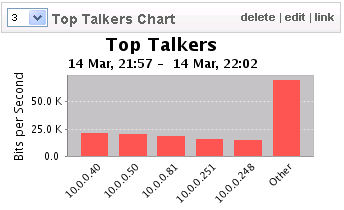
The Top Talkers Chart widget has the following settings:
- Category, select the traffic attribute to use as the category in the chart.
- Units, select how to scale values in the chart.
- Interval, the time period used to calculate the chart.
- Chart Type, select to display a pie or a bar chart.
- 3D, turn on/off 3D effect.
- Orientation, for bar charts, select horizontal or vertical orientation.
- Lookup Names, convert addresses to names.
- Where, a filter to apply so that only selected traffic is shown. For example, the filter protocol = ICMP would just display ICMP traffic.
Note The easiest way to construct a filter is to experiment on the Report>Explore page (use the Recent Traffic database). Once you are satisfied with the filter, copy and paste it into the widget settings.
Top Talkers Table
The Top Talkers Table widget displays the most active sources of traffic as a table.
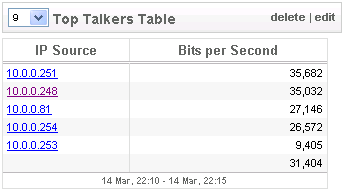
The Top Talkers Table widget has the following settings:
- Category, select the traffic attribute to use as the category in the table.
- Value, select the value to display in the table.
- Interval, the time period used to calculate the table.
- Lookup Names, convert addresses to names.
- Where, a filter to apply so that only selected traffic is shown. For example, the filter protocol = ICMP would just display ICMP traffic.
Note The easiest way to construct a filter is to experiment on the Report>Explore page (use the Recent Traffic database). Once you are satisfied with the filter, copy and paste it into the widget settings.
Traffic Trend
The Traffic Trend widget displays the total traffic on the network matching a filter.
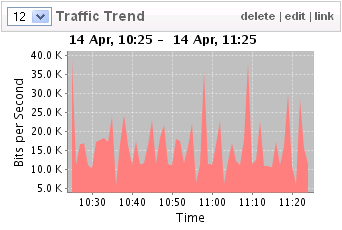
The Traffic Trend widget has the following settings:
- Units, select how to scale values in the chart.
- Where, a filter to apply so that only selected traffic is shown. For example, the filter protocol=ICMP would just display ICMP traffic.
Note The easiest way to construct a filter is to experiment on the Report>Explore page (use the Recent Traffic database). Once you are satisfied with the filter, copy and paste it into the widget settings.
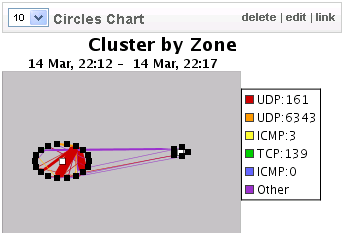
Circles Chart
The "Circles Chart" widget is a miniature version of the the chart displayed on the Traffic>Circles page. This widget provides a visual overview of the currently active connections on the network.
The Circles widget accepts the following settings:
- Cluster, determines how hosts are grouped into circles. You need to add your allocated subnets to the configuration file (on the File>Configure page) before hosts can be grouped.
- Interval, the time period over which the top connections will be computed.
- Where, a filter to be applied so that only selected traffic is shown. For example, the filter protocol = ICMP would just display ICMP traffic.
Note The easiest way to construct a filter is to experiment on the Traffic>Circles page and then copy and paste the filter into the widget settings.
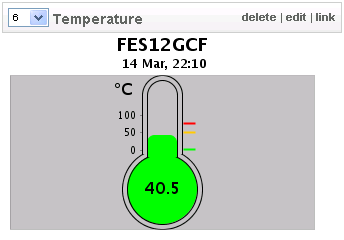
Temperature
The Temperature widget displays the temperature of a specified agent. It is able to display the temperature of Foundry, Juniper, Cisco, Force10 and Extreme Networks switches.
The Temperature widget accepts the following settings:
- Agent, select from a list of agents you have recently visited. If the agent you want isn't on the list, click on the Search button to find the agent.
- Warn, the start of the warning region (shown in yellow) on the thermometer.
- Severe, the start of the severe region (shown in red) on the thermometer.
- Maximum, the maximum value to show on the thermometer.
Note Temperatures are always represented in degrees Celsius.
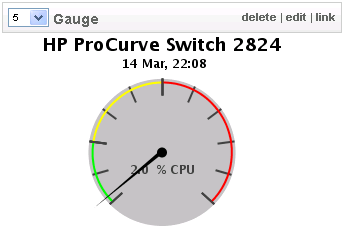
Gauge
The "Gauge" widget is used to display the value of an SNMP gauge. SNMP gauges are used to represent values that can increase and decrease, including: temperature, cpu utilization and memory usage.
The Gauge widget accepts the following arguments:
- Agent, select from a list of agents you have recently visited. If the agent you want is not on the list, click on the Search button to find the agent.
- OID, the OID (or object ID) corresponding to an SNMP gauge. The OID must be expressed in dotted decimal form.
- Units, a string used to label the result (usually the unit of measure e.g. %CPU, Degrees etc.)
- Scale Factor, a floating point number used to scale the result to the correct units. SNMP gauges can only have integer values so their units are often fractional. The value is multiplied by the scale factor to correct the units. For example, suppose a device wants to report a temperature of a temperature of 30.5 degrees with a 0.5 degree resolution. To represent 0.5 degree resolution the temperature would need to be represented as 61 with units of 0.5 of a degree. Setting the scale factor to 0.5 would correct the result so that it would show temperature in degrees.
- Warn, the start of the warning region (shown in yellow) on the gauge.
- Severe, the start of the severe region (shown in red) on the gauge.
- Maximum, the maximum value to show on the gauge.
For example, the following settings will monitor the CPU utilization on an HP ProCurve switch:
- OID = 1.3.6.1.4.1.11.2.14.11.5.1.9.6.1.0
- Units = % CPU
- Scale Factor = 1
- Warn = 20
- Severe = 60
- Maximum = 100
Note Finding out what gauges a particular switch supports and the corresponding OIDs can be difficult. A web search is often the best way to find the correct settings. Another place to look is the user forums on myinmon.com; you are encouraged to share any gauge settings that you think will be of interest to others.
Image
The Image widget is useful for incorporating information published as charts on web sites, or from other web-based tools. For example, you might want to include utilization charts from your ISP or you may want to display the transaction rates on critical servers. The image will be automatically refreshed so that it continues to display current data.
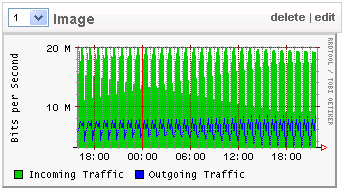
The Image widget accepts the following settings:
- URL the URL of the image.
- Height the height of the image (in pixels).
- Width the width of the image (in pixels).
Note Keep the width to 320 pixels or less so that the image fits into the widget layout (your browser will scale a larger image to fit). If the image is dynamically created there may be arguments that can be passed in the URL that will allow you to specify a height and a width so that the image will fit properly without scaling (this is desirable since scaling reduced the quality of the image).
iFrame
The iFrame widget is used to "frame" another web page. You can interact with the page in the iFrame and make queries. The iFrame is useful for integrating with other web-based tools, for example an IP address allocation tool.
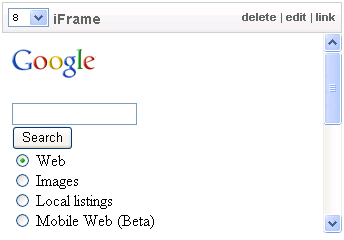
The iFrame widget accepts the following settings:
- URL, the URL of the web page to be framed.
- Height, the height (in pixels) to be allocated to the frame.
Note You can click on the link at the top of the iFrame widget to see the framed on the full browser screen.
Google Gadget
Google Gadgets are available to perform a wide variety of tasks.
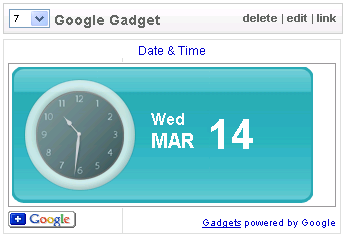
If you find a gadget in the Google directory that you are interested in using, the following steps can be used to add it to your dashboard:
- Click on the Add to your webpage button below the entry in the Google index.
- Make any settings changes that you want (you can click on the Preview Changed button at the bottom of the page to see the effect of changes).
- When you are satisfied, click on the Get the Code button to show the source code at the bottom of the page.
- Paste the code into the Script setting of a Google Gadget widget on your dashboard.
Note You should limit the width of Google Gadgets to 320 pixels so that they fit onto the dashboard.
| Related Topics |
|