
Querying and Reporting
Traffic Sentinel groups reporting into seven functional areas (accessed as tabs under the Reports menu):
- View Lists scheduled reports that are available for viewing. Select a report and view it in a web browser or as a PDF file.
- Explore Interactively explore historical traffic information and create charts.
- Query Select a query, specify parameters (such as time, protocol, interface) and run the query. The results can be viewed in a web browser or as a PDF file.
- Edit The report editor is used to assemble queries into reports. Headings, report text and query parameters can be modified in the report editor.
- Schedule Specify a schedule to automatically run reports, how long to keep each report and a list of email addresses to send the report to.
- Install Upload new report templates. Report templates are described in the Creating Report Templates tutorial.
- Script Scripting is described separately in the Scripting Queries tutorial. Most users will not need to use the scripting interface since existing queries available in the Explore and Query menus can be customized for most reporting tasks.
This tutorial is divided into three parts: Exploring Traffic describes how to interactively create charts and drill-down to traffic details, Making Queries provides an overview of the basic types of query that are available and provides examples demonstrating their use and Scheduled Reporting shows how queries can be combined into reports that are regularly scheduled.
Exploring Traffic
Traffic Sentinel maintains detailed historical databases that can be interactively explored using the Reports > Explore tool.
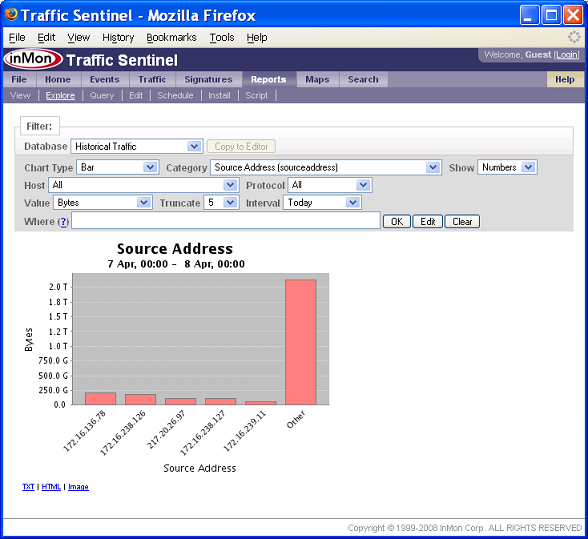
The chart above shows the top source addresses and the amount of traffic they generate. Suppose that you want to analyze the top source 172.16.136.78 in more detail - simply click on the bar and a filter will be added that selects only traffic from this source. Change the the Category to Destination Address to see the top destinations for traffic from 172.16.136.78. Change the Chart Type to Trend Stacked to trend the data over time.
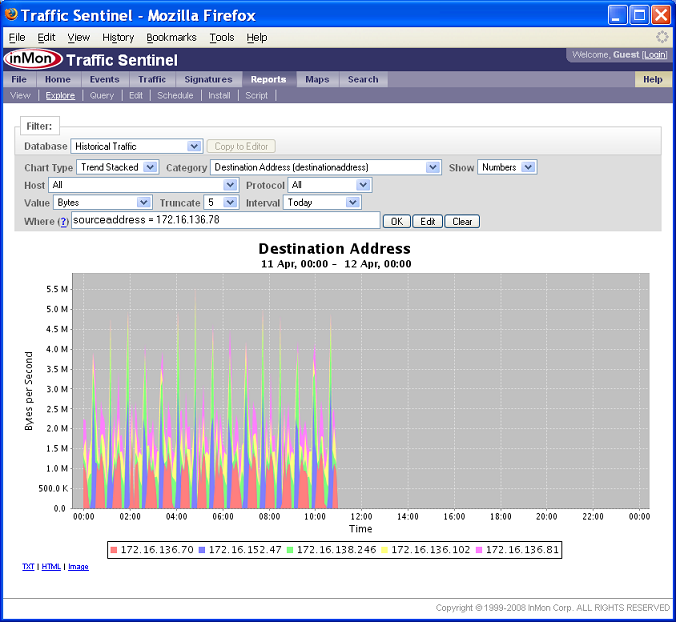
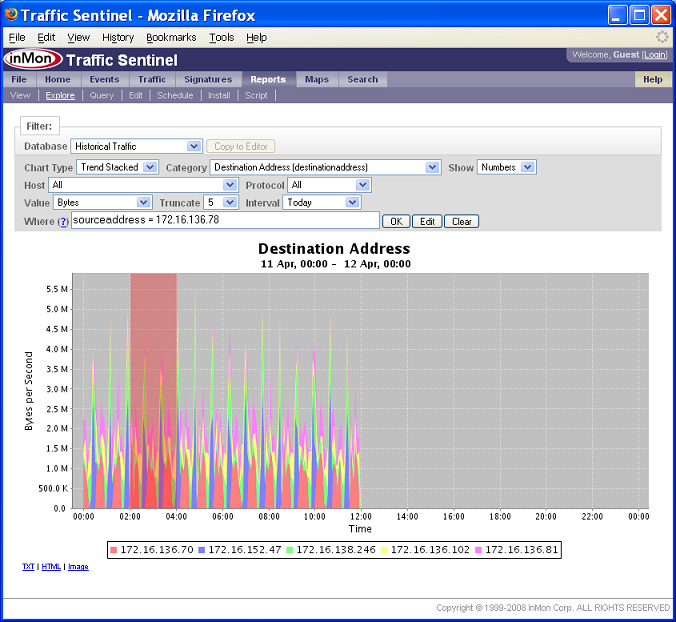
To zoom in to a particular time interval, say 2:00am to 4:00am, click on the chart and drag the mouse to highlight the interval you want.
The chart will be redrawn for the selected interval.
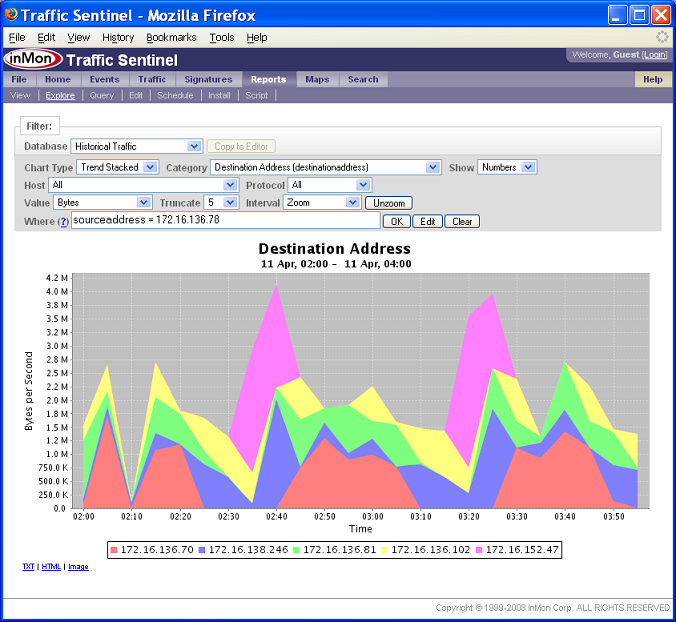
The Copy to Editor button is used to copy the chart into a report that is being edited under the Report>Edit page. If the button is inactive, then it means that there is no report currently being edited (see Editing a Report below).
Finally, notice the small TXT, HTML and Image links below the chart. These links can be used to access the data points plotted on the chart as a text or html table, or to extract the image.
For more information on the Explore tool, consult the online help (see Help>Report>Explore) by clicking on the Help link at the top right of the window.
Making Queries
Traffic Sentinel ships with a large number of pre-built queries that can be modified to answer most questions. Click on the Reports>Query menu to see a list of the available queries.
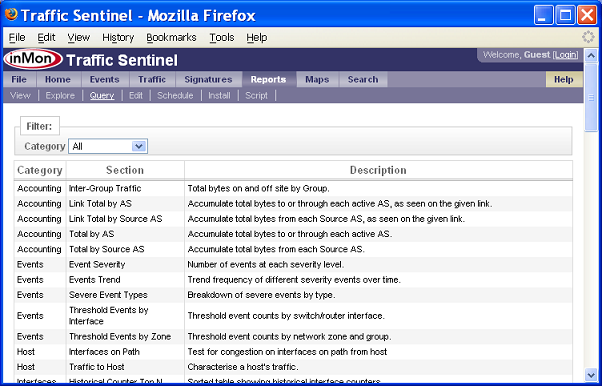
Queries are grouped into organizational Categories according to their general application area. For example, the "Security" category contains reports that are aimed at detecting and characterizing security threats and policy violations, while the "Inventory" reports are aimed at listing the various hosts and devices in your network.
Suppose we want to run to look at the traffic for a particular host, 172.16.136.78. This is a query about a host, so rather than search through all the queries, it is easier to change the Category from All to Host so that only host related queries are shown:
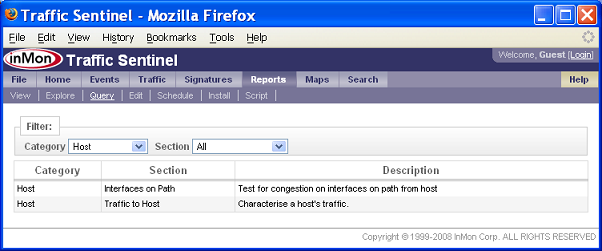
There are a couple of queries available. It looks like the Traffic to Host query is the one we want. Clicking on the Traffic to Host entry shows the query form:
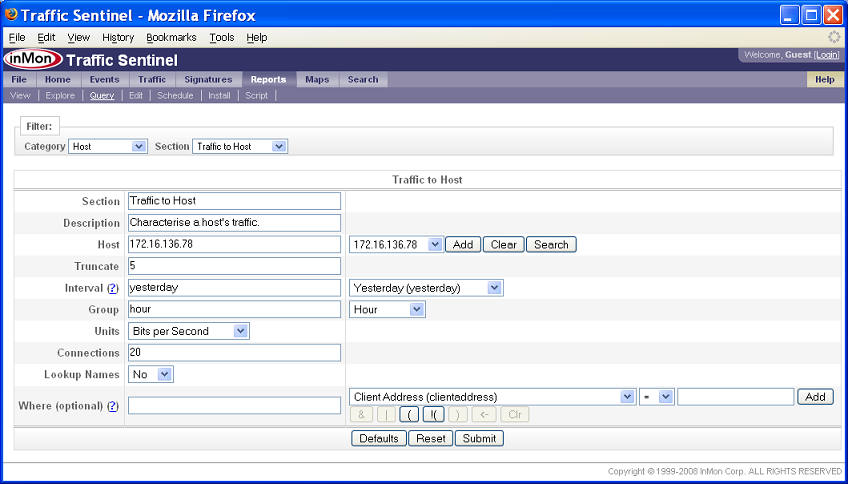
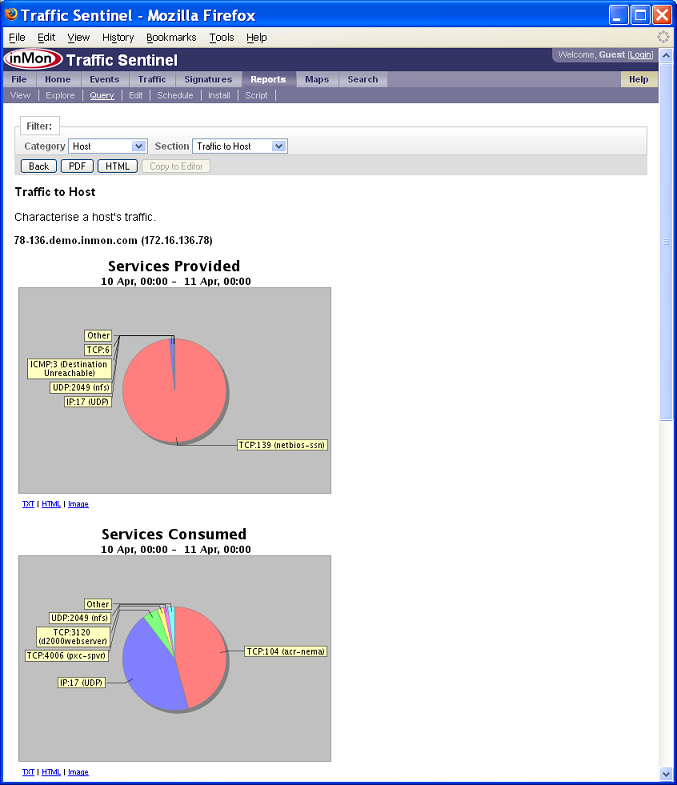
Enter the address of the host in the form and click Submit to see a report of the top services provided and consumed by the host, a trend of host traffic and list of top connections to the host.
Experiment with different parameter setting to see their effect. Some attributes have a menu to the right of the input field that can be used to input data rather than typing in the input field. Address, protocol and interface menues are populated with items that you have clicked on or searched for in the past.
Typical settings are provided in the menu for the time Interval, but if you have specific periods you want to report on, then custom intervals can be entered in the input box (see Help>Report>Run).
Many queries contain an optional Where input that can be used to specify boolean filters to further tailor the traffic displayed in the report. For example adding the expression:
iptos != 0in the Where field would only show traffic in which the IP type-of-service bits are set. Filter expressions are further described in Help>Report>Run.
A number of buttons appear at the top of the result page. Clicking on the PDF returns a copy of the report as a PDF, clicking on the HTML button returns an HTML copy. Clicking on the Back button returns to the form, allowing parameters to be changed. The Copy to Editor button is used to copy the query into a report that is being edited under the Report>Edit page. If the button is inactive, then it means that there is no report currently being edited (see Editing a Report below).
Finally, notice the small TXT, HTML and Image links below the chart. These links can be used to access the data points plotted on the chart as a text or html table, or to extract the image.
Note: The URL's associated with PDF, HTML, TXT or Image results can be bookmarked to run the query again. In addtion you can copy the URL into other tools (like Excel, wget, or curl) providing a way to repeat the query and obtain results.
Scheduled Reporting
Reports are constructed by selecting queries, configuring parameters and assembing the queries into a report. Once the report has been constructed, it can be scheduled to run automatically.
Editing a Report
The following steps are the easiest way to create a new report:
- Click on Reports>Edit to access the report editor.
- Click on the New Report button.
- Specify a Category, Report title and Description and click on the Submit to create an empty report.
- Click on either the Reports>Explore menu (see Exploring Traffic) or the Reports>Run (see Making Queries). When you looking a the query results you want, there will be a Copy to Editor button at the top of the query result page that will copy the query settings to a new section in the report.
The following screen shot shows the report editor after two sections have been added:
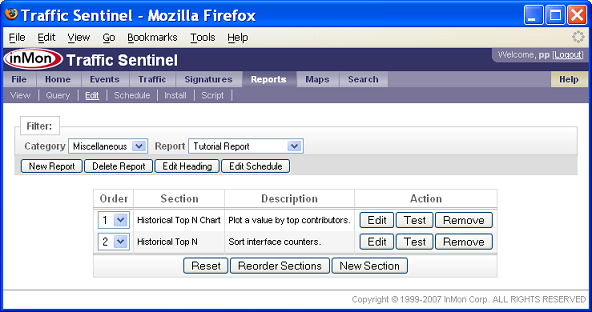
To re-order sections, specify section numbers and then click on the Reorder Sections button. Click on the Edit button next to a section to change its settings. Click on the Test button to test the new settings by running the query and showing the results. Click on the the Edit Heading button to change report title and description. Once you are happy with the report, click on the Edit Schedule button to schedule the report.
Scheduling a Report
The report schedule form is used to configure a report schedule:
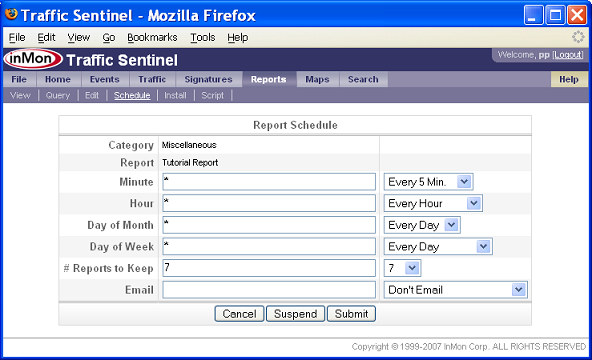
The Minute, Hour, Day of Month and Day of Week fields are used to specify how often to run the report. The menus contain typical options for each field. The #Reports to Keep specifies how many generations of the report to keep before older reports are deleted. The Email field is used to specify a list of email addresses to send the report to. Click on the Submit to schedule the report.
Schedule reports at periods that match their function. For example, an accounting report that summarizes traffic "Yesterday" should be scheduled to run once per day (usually in the early morning - the default reporting time is 1:05 am). If the report summarizes traffic "Last Week", then it should only be run once per week. Security reports are often configured to examine traffic over shorter periods and should be scheduled to run more often. For example a report that looks for port scanning activity over the "Last 5 Minutes" and that is set up to generate alerts should be run every 5 minutes.
The report will be automatically run at the specified intervals. Saved copies of the scheduled reports can be viewed in the Report>View page.
Viewing a Report
Click on the Report>View menu to view reports generated by the report scheduler. The View page shows the most recent copies of each report run by the report scheduler. If you have just scheduled a new report, it will not appear until the scheduler has run it at least one time.
| Related Topics |
|