
The following chart shows how 172.16.44.52's activity is spread across the the network:
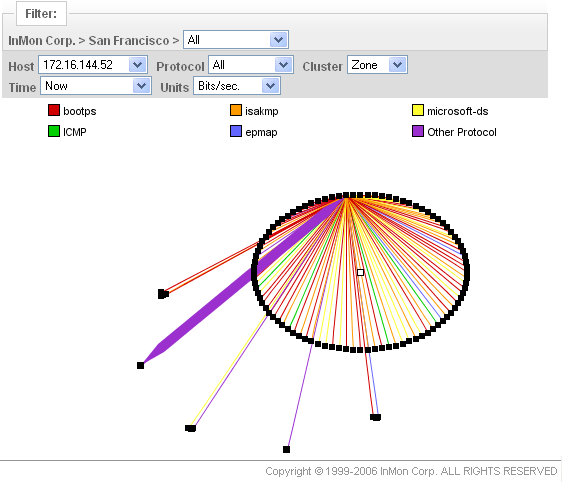
Each circle represents a different security zone and each dot represents a single host in that zone. The lines are network connections. This chart clearly shows that most of the activity has been contained to a single zone. The "fan" pattern that the lines make is typical of network scanning.
The next example demonstrates the use of packet signatures to rapidly detect intrusion attempts.