
Creating your own reports
Traffic Server automatically updates reports every 24 hours at a time specified by the PeriodicReportHour parameter in the Traffic Server configuration file.
Reports are generated based on template files. A template file consists of html interspersed with reporting directives. When a report template is processed the reporting directives are evaluated and html results are inserted in their place. The output is an html report containing traffic charts and tables.
Click on the Server > Reports menu on the left side of the Traffic Server window. You will be prompted for the administrator password.
 Figure 1 The Server > Reports form
The Server > Reports form in Figure 1 is used to install new report templates, view installed templates, manually run a report and view resulting reports. Copying and customizing an existing report template is a good way to get started.
There are two types of report template:
- Scheduled Scheduled reports are updated each night. By default reports will updated at 2am (this time can be changed by setting PeriodicReportHour in the configuration file).
- Interactive Interactive templates prompt for additional information before they can generate a report. When an interactive template is evaluated it will prompt for the missing parameters using a form.
This tutorial describes how to create a simple Scheduled report. It is recommended that this tutorial be completed before attempting to create Interactive templates (see Creating "interactive" reports).
The template in Figure 2 specifies a report that will show the top web servers for the previous day sorted by bytes:
<inmon>
action=set;
description=Top Web Servers;
date=yesterday
</inmon>

<inmon>
action=index;
category=Traffic
</inmon>

<html>
<head>
<title><inmon>action=print; variable=description</inmon></title>
</head>
<body>
<h1><inmon>action=print; variable=description</inmon></h1>
<p><b>[<inmon>action=date; format=range</inmon>]</b></p>


<inmon>
action=report;
tableType=TCP;
reportName=TopN;
reportFormat=chart;
includeData=yes;
categoryColumn=serverName;
serverPort=80,8080,8088;
valueColumn=bytes
</inmon>


</body>

</html>
Figure 2 Top Web Servers template file
The reporting directives in the template are highlighted in blue. All the black text is regular html. You can create this template using any text editor (e.g. notepad on Windows). Save the file on your PC, as topWebServers.txt say, and then use the Upload new report template function in the Server > Reports form to install the template (make sure that the template type is set to Scheduled).
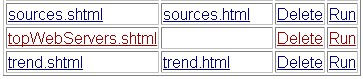 Figure 3 Run a report
The template topWebServers.shtml will appear in the Scheduled templates table (see Figure 3). In order to test the report template, click on the Run link.
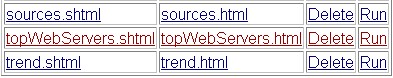 Figure 4 View results
The resulting report topWebServers.html will appear in the Report column of the table (see Figure 4). You can now view the report by clicking on its link (see Figure 5).
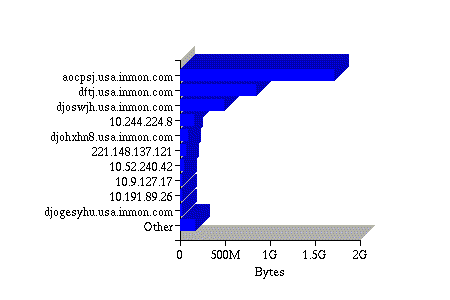 Figure 5 Top Web Server report [08-May-2002 00:00 to 09-May-2002 00:00]
This report will be updated every day and will appear in the report list accessed from the Reports > Reports menu.
Note: You will have to wait until the next automatic report period before the new report will appear in the index.
| Related Topics |
|