
Examining routing performance
Traffic Server's routing tools provide information on routing and quality of service across the Internet.
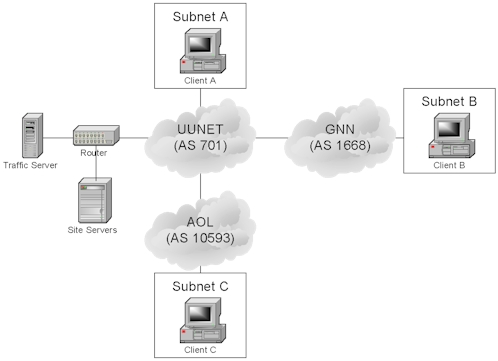 Figure 1 A site's view view of the Internet
Figure 1 illustrates the entities involved when a site network is connected to Internet. The Internet is a patchwork of interconnected networks. Each network connected to the the Internet is assigned an AS (Autonomous System) number that uniquely identifies it. Typically AS numbers are assigned to large ISPs or organizations with large networks. Destinations are grouped together in contiguous blocks of IP addresses called a subnet or a CIDR (Classless Inter-Domain Routing) block.
The site router uses BGP (Border Gateway Protocol) to select routes across the Internet. BGP provides a description of the routes to each subnet in the form of an AS-path (i.e. an ordered list of the AS numbers in the path to the subnet).
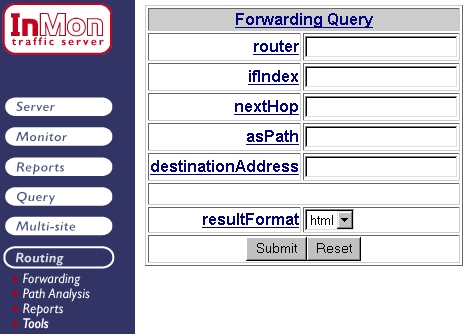 Figure 2: Forwarding Query
Figure 2 shows the Forwarding Query form that can be reached by clicking on the Routing > Forwarding menu option. To find all thr routes that end in AS 1668, simply enter -1668 in the asPath field and click Submit.
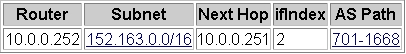 Figure 3 Routes to AS 1668
Figure 3 shows the result of a Forwarding Query. The table contains the IP address of the router from which the route was learned, the destination subnet, the next hop router in the path, the interface that will be used to forward packets to the next hop router and finally the AS-path associated with this route. The Subnet and AS Path values provide links to additional information. For example, clicking on the 701-1668 link provides the information shown in Figure 4.
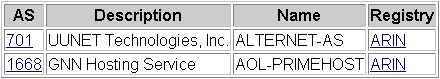 Figure 4 AS Path details
Traffic Server learns routes from the flow data it receives from sFlow or NetFlow sources. Since the routing tables are built from flow measurements only routes carrying traffic will be discovered. Unused routes will not be shown. NetFlow provides partial AS information - either the sources and destination ASs or the immediately adjacent (peer) ASs. sFlow provides full AS-Path information. An sFlow Probe can be used to generate sFlow using port mirroring, or add additional AS-Path information to NetFlow data.
An AS-Path provides a high level view of the route across the Internet. However, a more detailed view of the route is often needed to diagnose performance problems.
 Figure 5 Path Profiling
Figure 5 shows the routers involved in a typical path. Crossing an single AS may involve multiple router hops. In this case two routers are involved when packets traverse AS 1668. The AS-Path 701-1668 actually involves 5 individual routers. Congestion problems with any of these routers can adversely affect the performance of the entire route.
Traffic Server provides a mechanism for automatically mapping the detailed paths taken by each route. It also tracks delay and packet loss rates associated with each route so that performance problems can be easily identified.
The basic elements of the path profiling mechanism are shown in Figure 5. Traffic Server uses the flow data it collects to identify remote hosts and subnets. In the diagram, the red line indicates traffic between a remote host and a local server. For each "target" subnet it selects an active "target" host and starts to trace the route to the target subnet. It does this by making use of the time-to-live (TTL) mechanism built into the Internet Protocol (IP). A TTL is the number of hops a packet can take before a router will drop it, sending a notification back to the sender. Traffic Server generates a number of test packets, all addressed to the target host, each with an increased TTL. The route to the target subnet can be identified by examining the responses to the tests. In addition, round-trip delays and packet loss rates can be determined for each router on the path.
By default path profiling is disabled. It must be activated by including the directive TraceEnabled=YES in the Traffic Server configuration file. In addition, Traffic Server must receive route information from either sFlow or NetFlow sources so that is can identify target subnets and hosts.
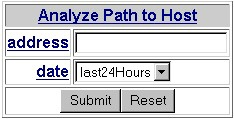 Figure 6 Path Analysis Query Form
The Path Analysis Query Form shown in Figure 6 can be reached by clicking on the Routing > Path Analysis menu item. You can enter the address (or domain name) of a remote host to report on a single path, or simply leave the address field blank and click on Submit to see a summary of all subnets.
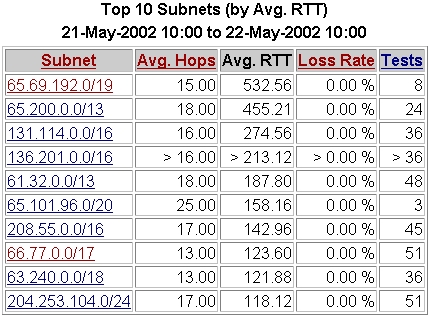 Figure 7 Top Subnets by Average RTT
Figure 7 shows the top subnets sorted by the average Round Trip Time (RTT). Clicking on column headings will re-sort the table. This table identifies subnet 65.69.192.0/19 as having the longest RTT - nearly half a second. Clicking on the subnet provides a detailed profile of the path to the subnet.
 Figure 8 Detailed Path Profile
Figure 8 shows a detailed path profile. Each router in the path is represented by a row in the table. The number of tests performed to each router is indicated, as are the RTT and packet loss rates measured for that router. The red boxes indicate that multiple routers were seen at a particular number of hops. This indicates that there may by multiple routes in use, or that there may be some route instability.
The path profile report also provides additional links (not shown) to real-time displays of traffic on the path. This allows hosts and services that are being impacted by poor performance to be identified.
| Related Topics |
|