
Drill-down traffic analysis
Traffic Sentinel provides a number of tools for real-time network monitoring and trouble shooting. These tools are accessed through the Traffic menu at the top of the Traffic Sentinel window. The Traffic functions are most effective when thresholds, zones, groups have been defined (see Configuring Traffic Sentinel).
Network trouble-shooting has three main phases:
- Entry, select a starting point based on the event that triggered the investigation.
- Drill-down, explore the problem and identify a root cause.
- Resolution, plan a resolution to the problem.
The remainder of this tutorial works through the trouble-shooting steps using examples.
1. Entry
There are a number of ways you are likely to enter Traffic Sentinel to start an investigation:
1.1 Events
You may receive an event through RSS, email, syslog, SNMP Trap or by using your web browser to monitor the Events>Summary or Events>List pages (Note: The Events>Summary is also available as a widget that can be included on your home page).
In all of these cases, clicking on event links will take you to a page containing details about the event.
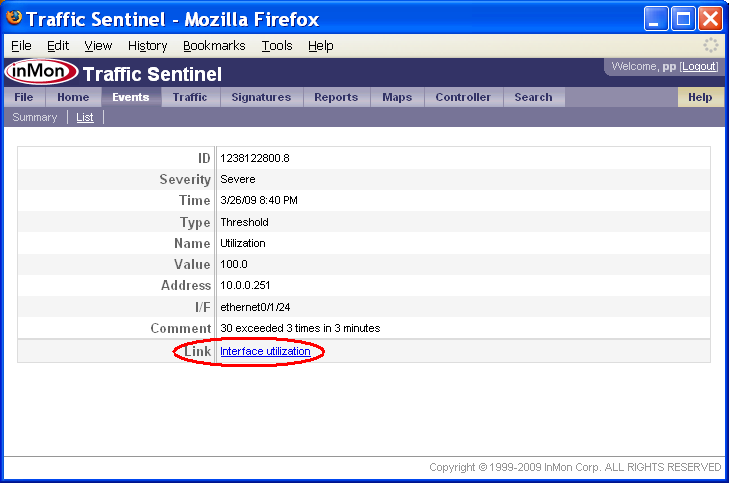
At the bottom of the event page, there may be one or more Link rows. Clicking on these links provides a starting point for analyzing the event. In this case, the utilization threshold event links to a Traffic>Trend chart displaying utilization of the interface.
1.2 Home>Dashboard
Each user can create their own customized home page showing all the critical information needed to monitor network health.
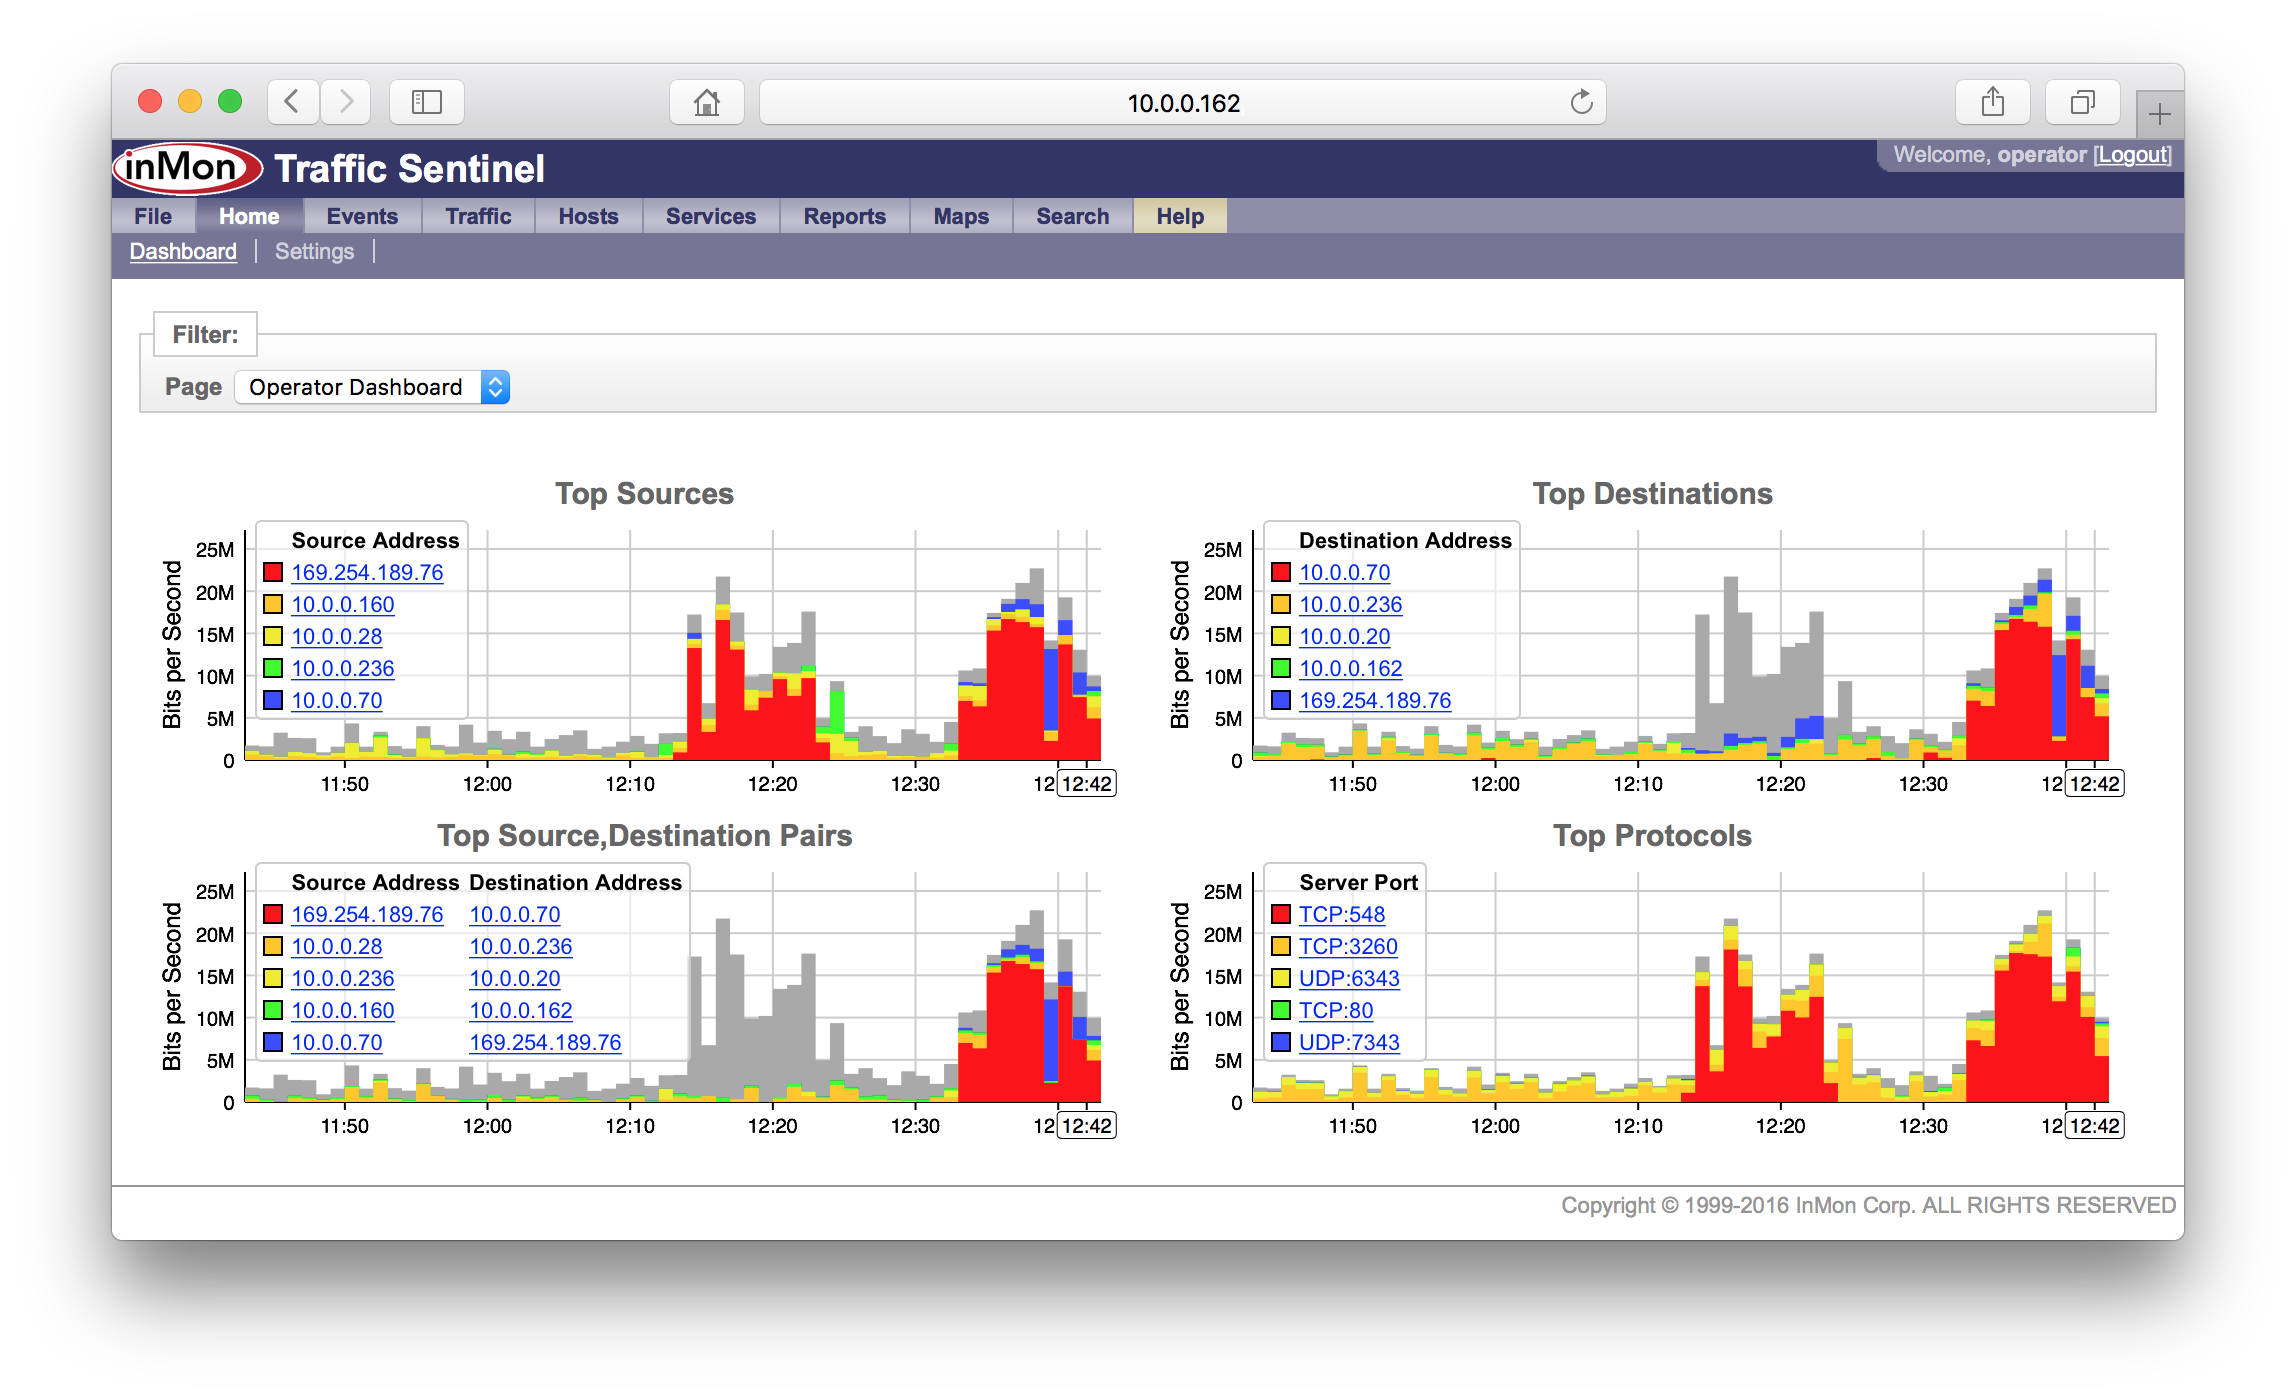
Charts in the dashboad can contain links that can be used to drill-down and analyze the data shown in the chart.
1.3 Traffic>Status
The Traffic>Status page shows the status of the devices and links in the network.
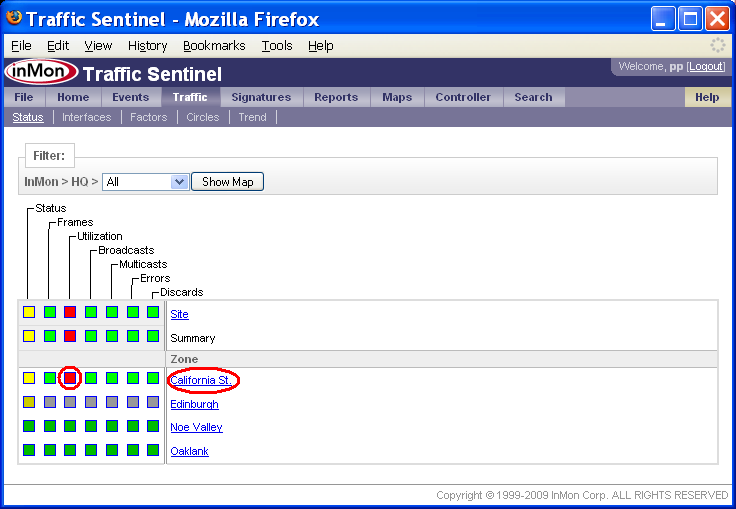
Clicking on any of the squares in the grid will drill-down to more detail about the status. Clicking on row labels will expand detail for the selected part of the network.
1.4 Search>Host
The Search>Host page is the place to start if you want to locate a host, or identify possible performance problems with a host (perhaps because a user called complaining of poor network performance).
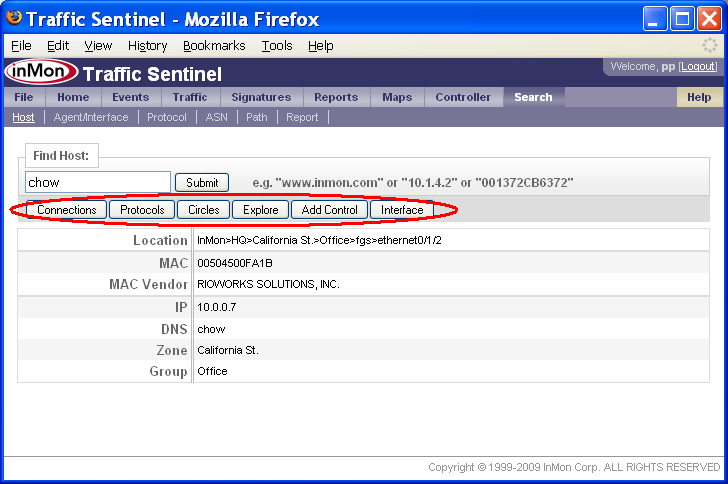
The search result provides additional information about the host, its location and addresses. The buttons along the top link to different tools that can be used to find out more about the address.
Note: Clicking on addresses anywhere in Traffic Sentinel will bring you to the Search>Host page, providing links that let you focus your investigation on the host. Since each Traffic Sentinel page remembers its own settings you can always navigate back to a page using the tabs at the top of the screen and return to the data you were viewing.
1.5 Search>Agent/Interface
The Search>Agent/Interface page is the starting point to search for a agent or interface based on its description or address.
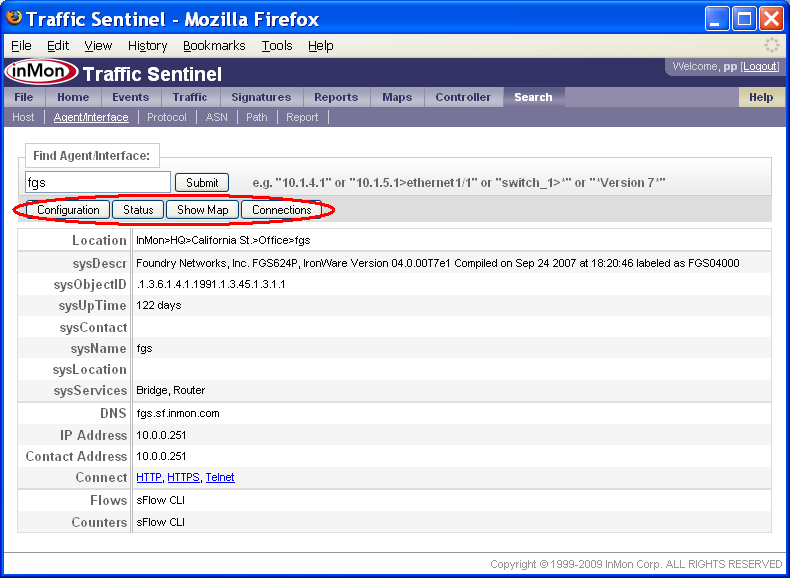
The search result provides additional information about the agent and interface. The buttons along the top link to different tools that can be used to find out more about the agent.
Note: Clicking on agents and interfaces anywhere in Traffic Sentinel will bring you to the Search>Agent/Interface page, providing links that let you focus your investigation on the agent. Since each Traffic Sentinel page remembers its own settings you can always navigate back to a page using the tabs at the top of the screen and return to the data you were viewing.
1.6 Search>Protocol
The Search>Protocol page is the starting point for analyzing a protocol.
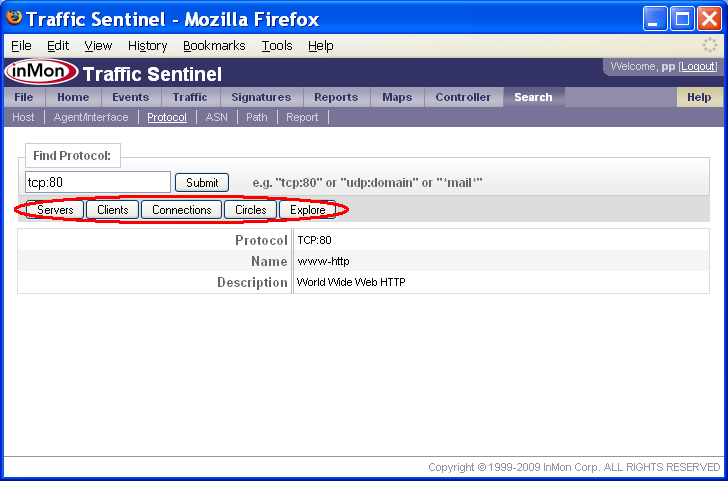
The search result provides additional information about the protocol. The buttons along the top link to different tools that can be used to find out more about the protocol.
Note: Clicking on protocols anywhere in Traffic Sentinel will bring you to the Search>Protocol page, providing links that let you focus your investigation on the protocol. Since each Traffic Sentinel page remembers its own settings, you can always navigate back to a page using the tabs across the top of the screen and return to the data you were viewing.
2. Drill-down
The top level tabs in Traffic Sentinel separate different functional areas, or tools, withing the product. Each tool has sub-tabs for different activities within the tool. Sub-tabs within a tool often share a number of settings, so you can change a setting in one sub-tab and change to another sub-tab without having to re-enter the setting. Settings made within each page are remembered, so you can quickly move between tabs and look at the problem in different ways with different tools, refining your analysis and returning to previous tabs without loosing your place.
During the investigation phase, you will be narrowing the scope of queries in order to discover the nature and scope of the problem.
The following tabs are uses most freqently used to investigate traffic problems.
2.1 Traffic
The Traffic tools work together; sharing Filter: attributes. All the tools share the path attribute; scoping the analysis to network Zone, Group, Agent and Port. The Factors, Circles and Trend tools display traffic in different ways and share additional filter settings.
2.1.1 Traffic>Status
The Traffic>Status page was introduced earlier as one of the entry points into Traffic Sentinel.
Clicking on the red square,
![]() ,
in the Utilization column, links to the
Traffic>Interfaces page, displaying
information about utilization on interfaces in the California St. Zone.
,
in the Utilization column, links to the
Traffic>Interfaces page, displaying
information about utilization on interfaces in the California St. Zone.
The Traffic>Status page is also a useful tool for exploring the network hierarchy. Clicking on the California St. link displays the groups in the zone. Continuing to drill down on the part of the network with the utilization threshold violation leads to a detailed switch view, showing the interfaces on the selected switch.
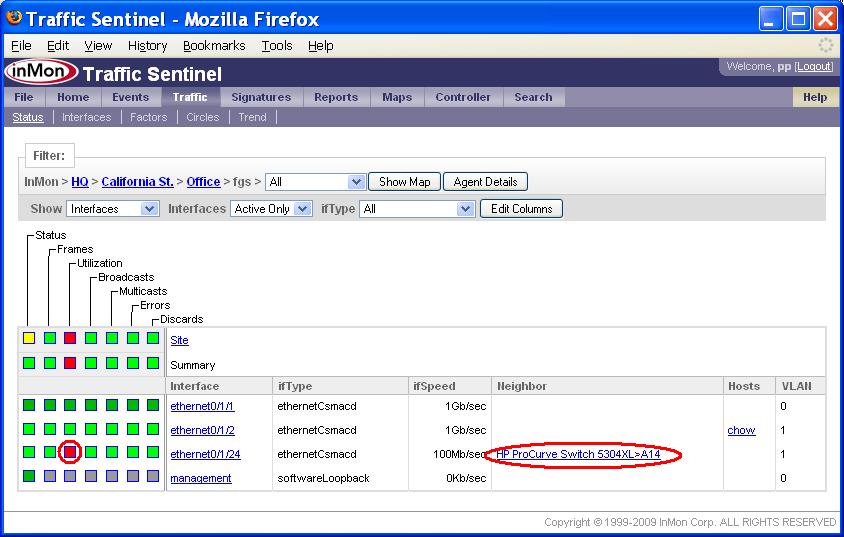
The Filter: bar now indicates that we are looks at the path InMon>HQ>California St.>Office>fgs (i.e. zone=California St., group=Office and agent=fgs).
You can see that the threshold violation occured on interface ethernet0/1/24 and that this 100Mb/sec interface is connected to switch HP ProCurve Switch 5304XL on interface A14. Clicking on the neighbor link takes you to the Search>Agent/Interface page.
The detailed interfaces view also shows which hosts are connected to this switch - you can see that chow is connected to interfaces ethernet0/1/2. It is worth noting that hosts are connected to the switch at 1Gb/sec and that the uplink is only a 100Mb/sec link so it is not surprising that the uplink is generating utilization alerts.
2.1.2 Traffic>Interfaces
The Traffic>Interfaces page displays a sorted table of the interfaces in the current Filter: path.
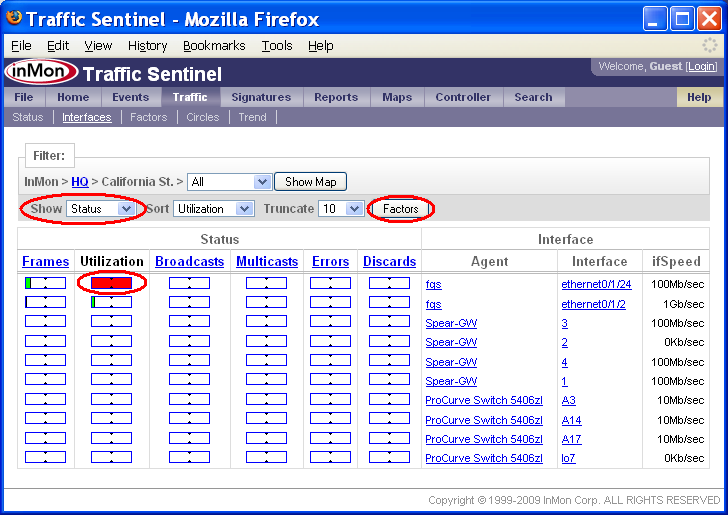
In this example, all the interfaces on the site have been sorted by Utilization and it is clear that threshold violation occured on Agent fgs and Interface ethernet0/1/24. You can also see that no other interfaces are close to reaching their utilization thresholds, so the problem is localized to a single link. Clicking on the red bar will take you to the Traffic>Trend page, displaying the utilization trend for the interface.
The Show setting is set to Status. The Status setting indicates that bars in the table represent the fraction of threshold value for each of the interface counters. Changing the Show setting to Counters displays the actual counter values.
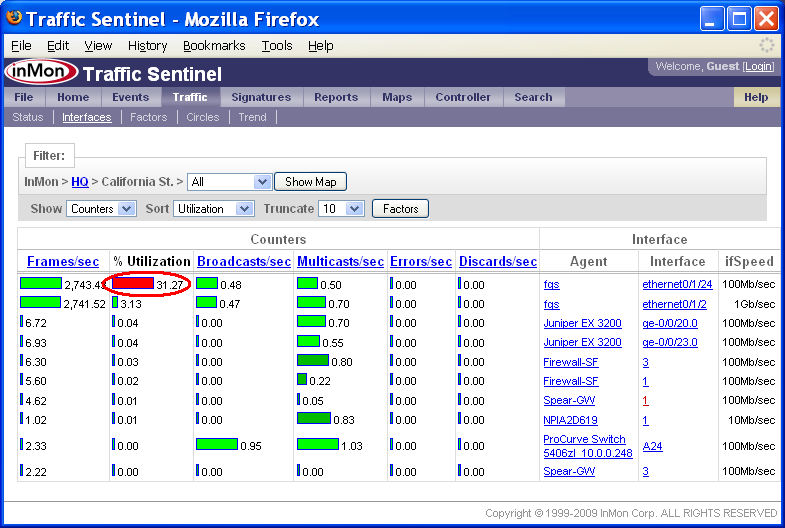
Again, it is clear that threshold violation occured on Agent fgs and Interface ethernet0/1/24 and that the current utilization of the interface is 31.27%. Clicking on the red bar will take you to the Traffic>Trend page, displaying the utilization trend for the interface.
Other Filter: settings allow you to sort the table by different counters and change the number of entries in the table.
Note: The Factors button will take you to the Traffic>Factors page to analyze the traffic causing the threshold violations. The button is only enabled if there are threshold violations.
2.1.3 Traffic>Trend
The Traffic>Trend page provides a real time view of interface counters and traffic flows.
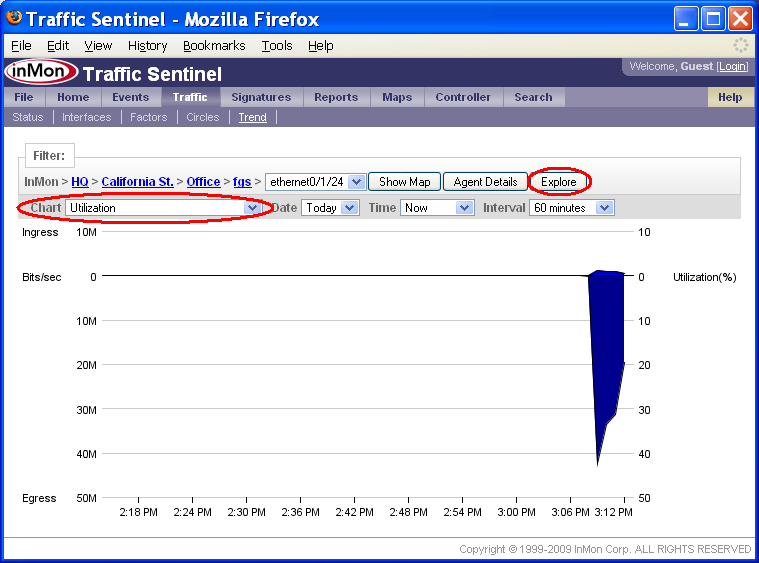
This chart shows that the utilization on fgs interface ethernet0/1/24 has been high for the last 4 minutes. To find out who is generating the traffic on this interface, switch the Chart setting to Top Connections.
Note: To trend link utilization over a much longer time period, click on the Explore button to go to the Reports>Explore page.
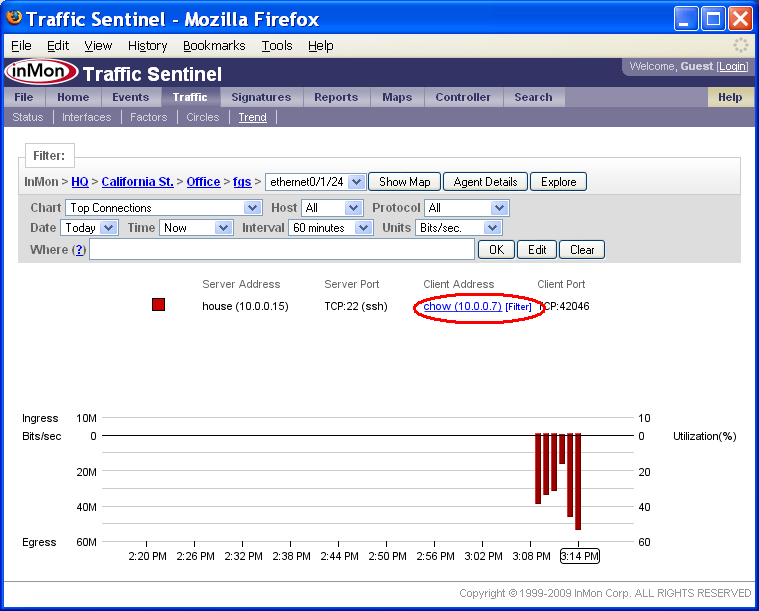
The Top Connections chart shows that the increase in traffic is due to a TCP:22 (ssh) connection between chow (10.0.0.7) and house (10.0.0.15).
If you move your mouse over items in the chart legend, you will see that each address and protocol is a link. Clicking on the address or protocol will take you to the corresponding Search page. Clicking on the [Filter] link next to each legend item adds a filter to select the specified traffic. In this example, clicking on the [Filter] link next to chow (10.0.0.7) in the Client Address column adds a filter to only show connection that chow initiated.
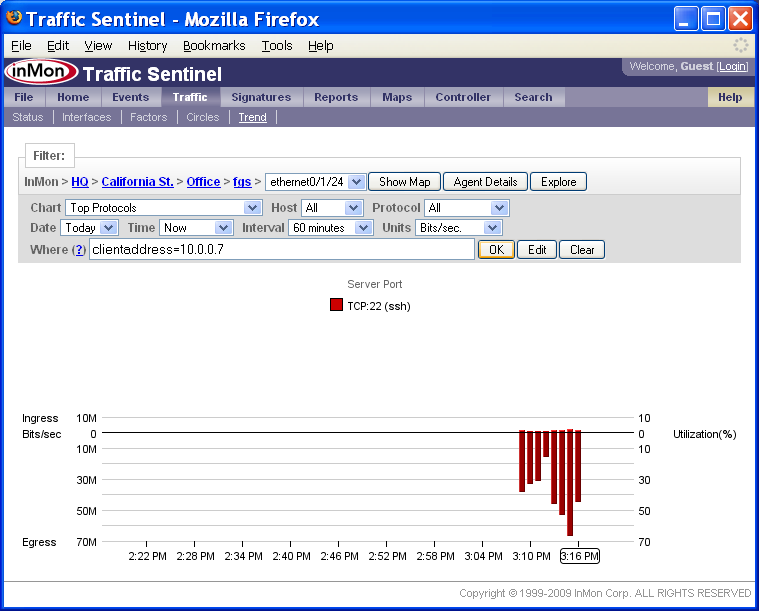
Notice that the Where filter is now set to:
clientaddress = 10.0.0.7
The chart Show setting has also been changed to display the Top Protocols. The chart shows that all the traffic originating from 10.0.0.7 is TCP:22 (ssh).
Note: You can construct complex Where filters using boolean expressions to select specific traffic. Click on the (?) link next to the Where filter to get more information on constructing filters.
Note: The Traffic>Trend page is not restricted to a single interface. Just change the Filter: path setting to the part of the network you want to examine and traffic though all the switches and interfaces in the selected path will be combined and displayed.
2.1.4 Traffic>Factors
The Traffic>Factors identifies common attributes among packets observed on the network.
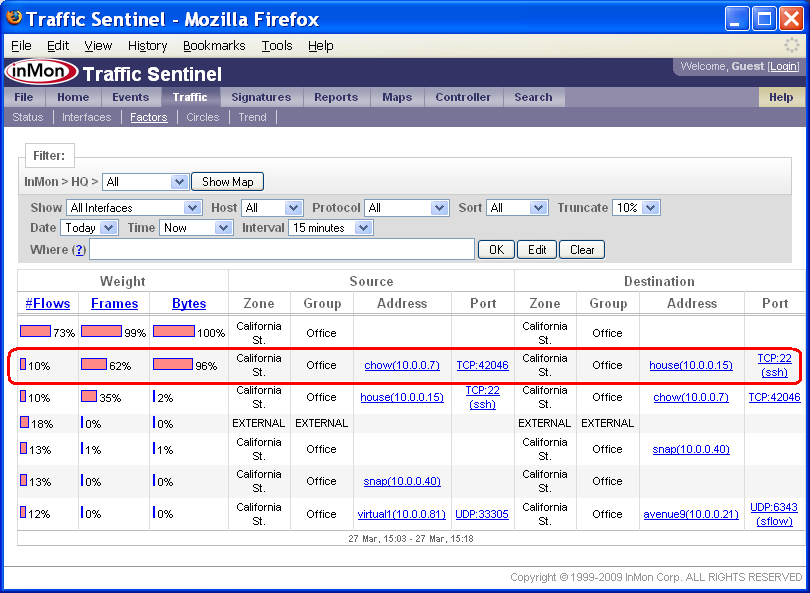
One way to understand what is being displayed is to think how you would normally try and trouble shoot a traffic problem. You might look at top source addresses sorted by bytes transferred to see who is using bandwidth. You might look at top destinations sorted by number of packets to see any of your servers are suffering a denial of service attack. The Factors page summarizes all possible Top Source, Top Destination, Top Source-Destination, Top Protocol etc. charts in a single table allowing you to quickly see what attributes or attribute combinations are common to the traffic on the network.
The highlighted row in this Factors table shows that 96% of the bytes on the network are due to a single connection between chow (10.0.0.7) and house (10.0.0.15) and that the protocol is TCP:22 (ssh).
Note: You can change the Show setting to only show traffic on interfaces that are exceeding thresholds. If you click on bars in the table, you will create a Where filter that selects traffic that matches the attributes in the row.
2.1.5 Traffic>Circles
The Circles page displays the top 100 traffic flows between hosts clustered by Zone, Group, CIDR or Agent.
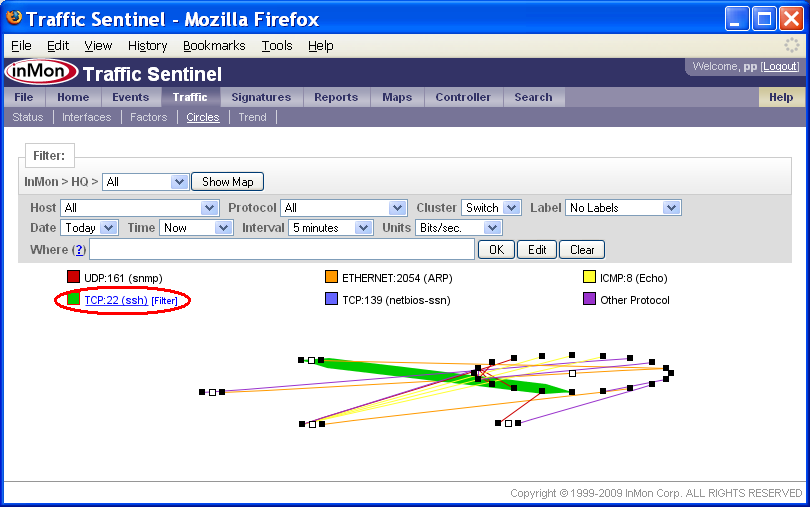
In the Circles chart above, each dot represents an active host, the lines represent traffic flows between the hosts, the line widths the amount of traffic and the colors the protocol. In this example each circle of hosts represents a Switch (determined by the Cluster setting).
If you move your mouse over items in the Circles legend, you will see that each protocol is a link. Clicking on the protocol will take you to the Search>Protocol page. Clicking on the [Filter] link next to each legend item adds a filter to select the specified traffic.
2.2 Reports>Explore
The Explore page is used to query historical data.
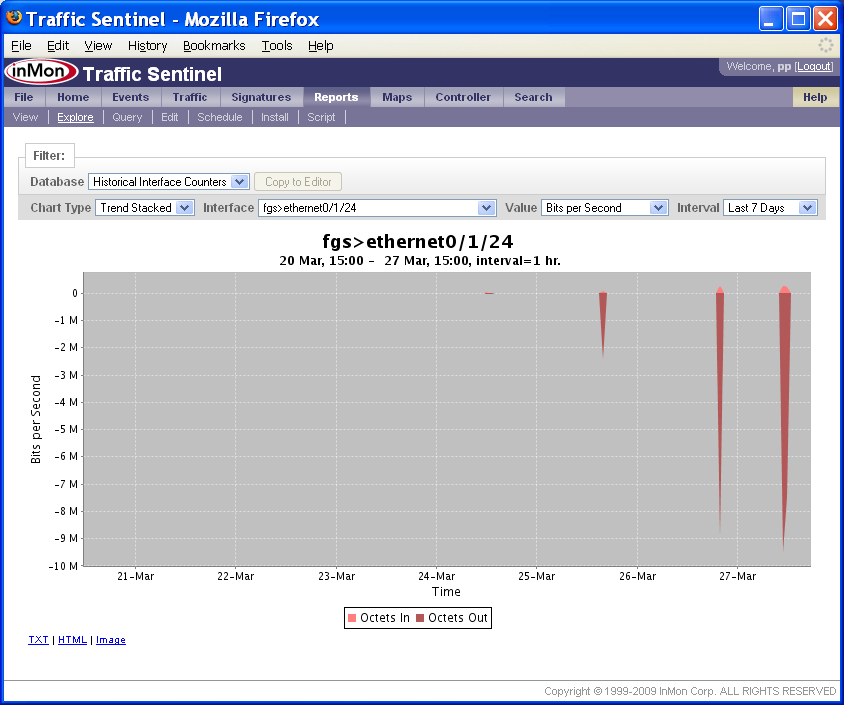
In this example the chart shows a 7 day trend in the traffic on agent fgs, interface ethernet0/1/24.
To zoom in on a partical time range, use the mouse to drag a rectangle on the chart.
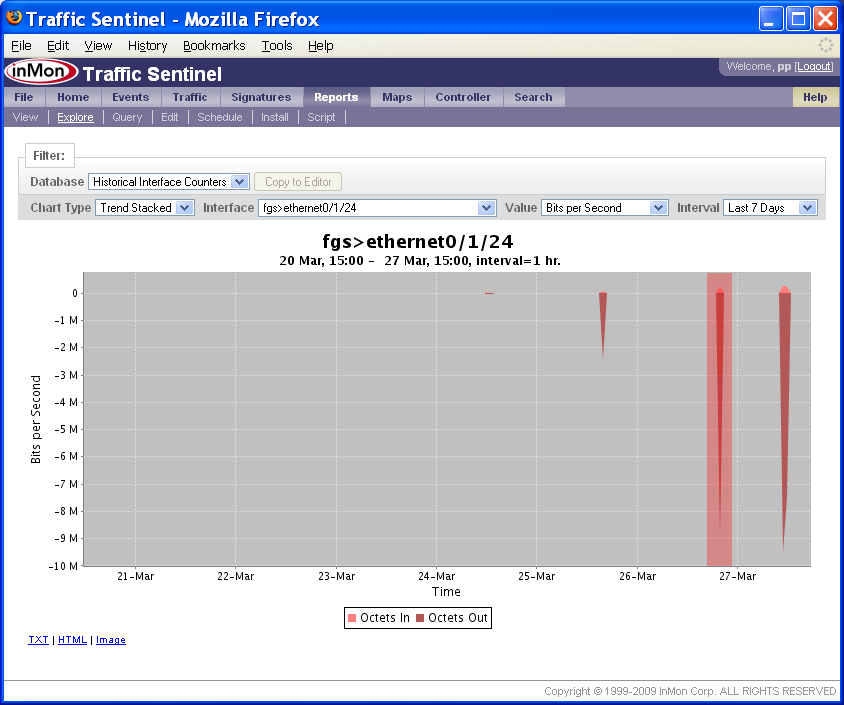
The above chart shows a zoom rectangle being drawn over the spike in traffic on the 27-Mar.
The Explore tool can also be used to look at traffic flow information. The following chart trends top traffic sources over a 7 day period.
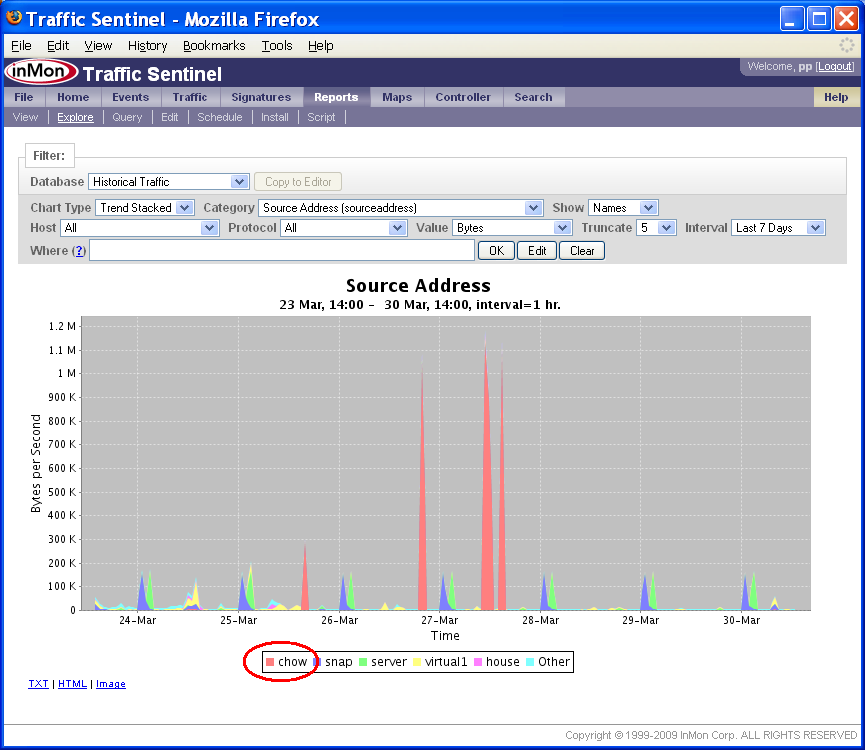
Where filters can be added by clicking on items in the chart legend. In this example we click on chow in the legend.
Notice that the Where filter is now set to:
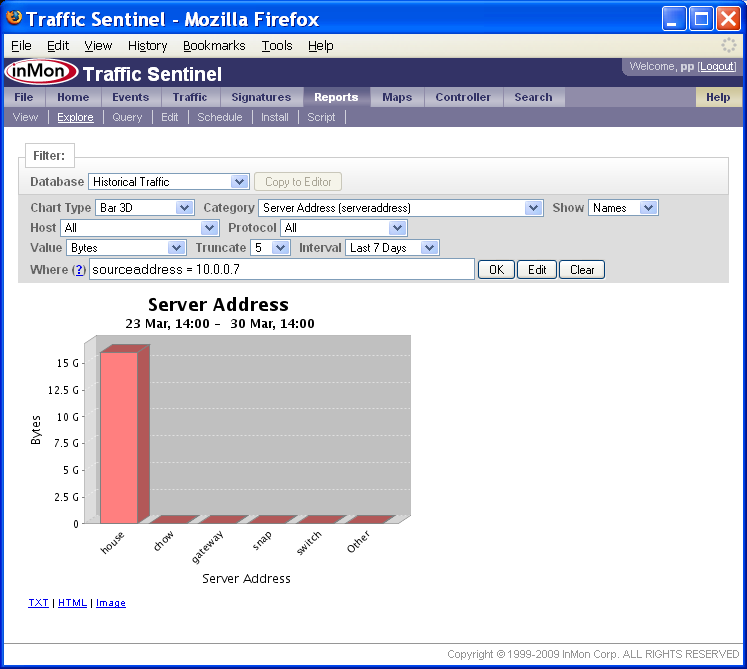
sourceaddress=10.0.0.7
The Chart Type has been changed to Bar 3D and the Category has been changed to Server Address (serveraddress).
Note: The TXT, HTML and Image links below the chart can be used to access the chart data and the chart image.
2.3 Maps
The Map pages show the network topology.
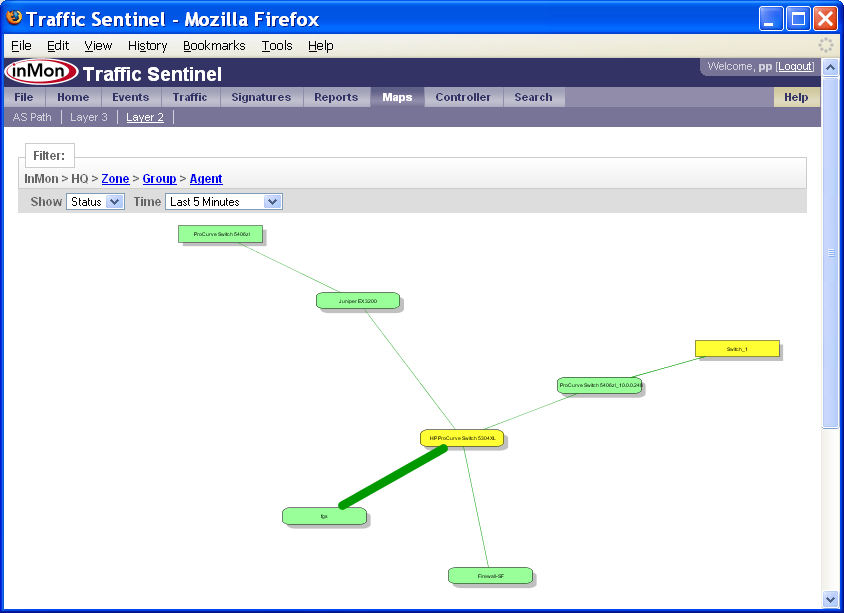
In this example the colors represent status and the thickness of the lines represents the amount of traffic on each link.
Note: You can use your mouse to drag the map and the right button menu (or mouse scroll wheel if you have one) to zoom in and out and expand and collapse items on the map.
Note: The Zone, Group and Agent links in the Filter: bar dispays a map of the zones, groups and agents respectively.
2.4 Search
The Search>Host, Search>Agent/Interface and Search>Protocol pages are an important part of drill-down analysis. Whenever you click on links relating addresses, protocols or agents you will be taken to these pages. The pages provide details about the selected items and links that let you focus your analysis on the selected item.
Traffic Sentinel keeps track of the settings on each page, so when you jump to one of the Search pages, you don't loose the settings and data you were looking at. Just click on the tabs at the top of the page to return to the tool you were using or flip between different data that you were looking at in the Traffic, Reports, Maps and Search tabs.
3. Resolution
Once the problem has been explored and understood during the drill-down phase, Traffic Sentinel's tools can be used to help resolve the problem.
When deciding on a plan of action, such as disconnecting an infected host, it's important to consider the impact of the action on the rest of the network. Traffic Sentinel can be used to see what hosts may be affected by the change (for example, because they rely on critical services, such as DNS, provided by host that you are planning to disconnect). Understanding dependencies helps you plan changes and minimize negative impact on service.
Finally, Traffic Sentinel's Controller (see Enforcing Usage Quotas) can be used to implement traffic controls to mitigate many types of traffic problem while more permanent solutions are implemented.
| Related Topics |
|