
Monitoring multiple sites
Traffic Server has a number of capabilities that address multi-site deployment. When monitoring a large multi-site network it is generally advisable to install a Traffic Server on each site. This minimises the amount of Wide Area Network (WAN) traffic resulting from network monitoring activities and reduces the likelihood that traffic accounting will be lost due to failures in the WAN. The multi-site capabilities fuse together all the Traffic Servers in an enterprise into a single traffic monitoring service.
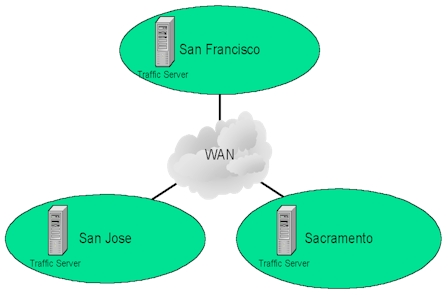 Figure 1 Multiple sites
Figure 1 shows a typical multi-site deployment with three campus networks connected by a WAN. The first step in a successful multi-site deployment is the creation of a shared configuration file for all the Traffic Servers in the enterprise. The shared configuration file allows each Traffic Server to understand which subnets are on which sites and to make tests between sites, providing integrated, enterprise-wide access to traffic data.
[enterprise]
name = "InMon Corp."

[site]
  name = "San Francisco"
  managerName = "Neil McKee"
  managerTelephone = 564-4267
  server= ts.sf.inmon.com
  softwareKey = 39B85B47FFFFFFFF0003FFFF7B72ADEC6413C46F3DCBB01E15DB85CA

...

[site]
  name = "Sacramento"
  managerName = "Peter Phaal"
  managerTelephone = 661-6343
  server = ts.sc.inmon.com
  softwareKey = 3CA6735EFFFFFFFF0001FFFF3D8AB0717BD26DD25EE3EE0A845F4552

...

[site]
  name = "San Jose"
  managerName = "Sonia Panchen"
  managerTelephone = 322-2345
  server = ts.sj.inmon.com
  softwareKey = 3C0EEDFAFFFFFFFF0003FFFFFF0BC78EC532C49A1237493DC29E3675

...
Figure 2 Multi-site configuration file
Figure 2 shows parts of a multi-site configuration file. Each [site] section in the configuration file specifies the Traffic Server responsible for monitoring that site. Additional information such as the managerTelephone and managerName parameters provide additional administrative contact information. The same configuration file is installed on all three Traffic Servers.
 Figure 3 Multi-site status
The multi-site status view shown in Figure 3 is reached by clicking on the Multi-site > Status menu option. Figure 3 shows the view that would be presented by the Traffic Server on the San Francisco site. The view shows that both remote sites are currently accessible. In the event that a remote site becomes unreachable, an event will be generated.
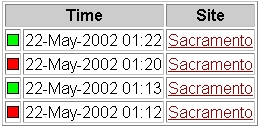 Figure 4 Site availability event log
Figure 4 shows a view of the site availability event log. This view is reached by clicking on the Multi-site > Events menu option. As well as logging events Traffic Server can forward them via email, syslog or SNMP Traps to other network management system (see Setting thresholds, events and alarms). Clicking on the Sacramento site in the event log provides additional information on the site.
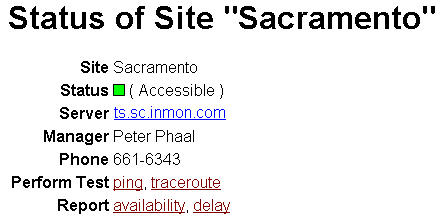 Figure 5 Site details
Figure 5 shows detailed information on a remote site. As well as providing administrative information, this view provides a link to the Traffic Server responsble for the Sacramento site. It also allows active ping and traceroute tests to be performed to the remote site. In this case we decided to view the Sacramento site because of connectivity problems reported in the event log. An availablity trend chart can be obtained by clicking on the availablity link.
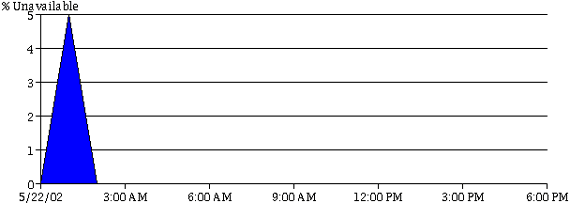 Figure 6 Site availability trend between San Francisco and Sacramento
Figure 6 shows the trend in availability between San Francisco and Sacramento. It indicates that 5% of the inter-site availability tests failed during the hour between 1am and 2am.
The Multi-site > Reports menu item provides access to reports that compare the historical delay and availability of each site.
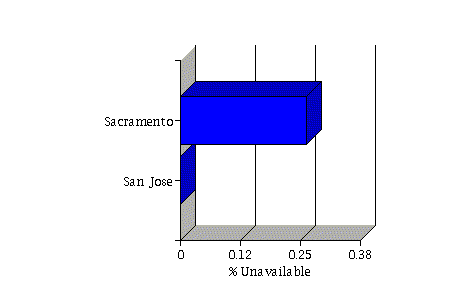 Figure 7 Multi-site availability
Figure 7 demonstrates a multi-site availability report showing that the connectivity to the Sacramento site is significantly less reliable than connectivity to the San Jose site.
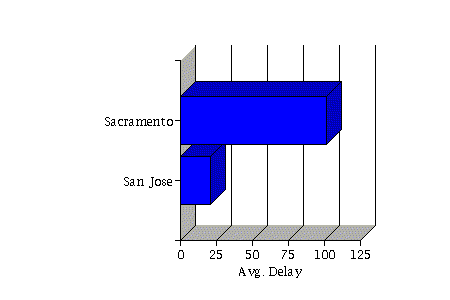 Figure 8 Multi-site delay
Figure 8 demonstrates a multi-site delay report showing that the average round trip delay to the Sacramento site is over four times that to the San Jose site.
Clicking on the Sacramento site in the chart and following the links to the delay report plots a delay trend for between San Francisco and Sacramento.
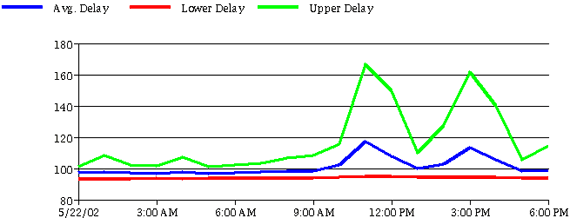 Figure 9 Delay trend
Figure 9 demonstrates a delay trend chart. The increase in average delay during business hours 9am-12noon and 2pm-5pm is clearly seen.
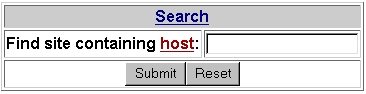 Figure 10 Multi-site search
Figure 10 shows the Search form accessible from the Multi-site > Search menu option. It allows you to enter a host name or IP address and jump to the site containing that address. This capability is particularly useful if you detect suspicous traffic and would like to track down the source. Once you jump to the Traffic Server on the site containing the address you can use the Monitor > Host menu item to locate the switch port connecting the host to the network. You can monitor all the traffic from the host in real-time, profile its historical behavior and connect to the switch to control the problem (disabling the port, add an access control entry or alter traffic priorities).
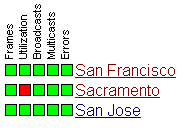 Figure 11 Multi-site traffic
Finally, clicking on the Multi-site > Traffic menu item provides access to a network-wide view of network traffic, identifying traffic problems anywhere in the network. Figure 11 shows a multi-site traffic view and it is immediately clear that there are congestion problems on the Sacramento network. Clicking on the red box (![]() ) allows you to rapidly drill-down to the cause of the problem (see Drill-down to identify sources of congestion).
) allows you to rapidly drill-down to the cause of the problem (see Drill-down to identify sources of congestion).
| Related Topics |
|